Multilevel Modeing (with R) Part 1
Princeton University
2024-01-31
Overview
The nuts and bolts of multilevel models
- Why do we need multilevel models? what are they? and why are they awesome?
- Important terminology
- How we specify MLMs (in code and mathematically)
How to do it (Monday)
- Organizing data for MLM analysis
- Estimation
- Fit and interpret multilevel models
- Effect size
- Power
- Visualizing data
- Reporting
Packages
- Packages you will need
- Follow along by downloading .qmd file here: https://github.com/jgeller112/PSY504-Advanced-Stats-S24/blob/main/slides/02-MLM/MLM.qmd
Why multilevel modeling?
- Let’s look at the relationship between SES and math achievement
Why multilevel modeling?
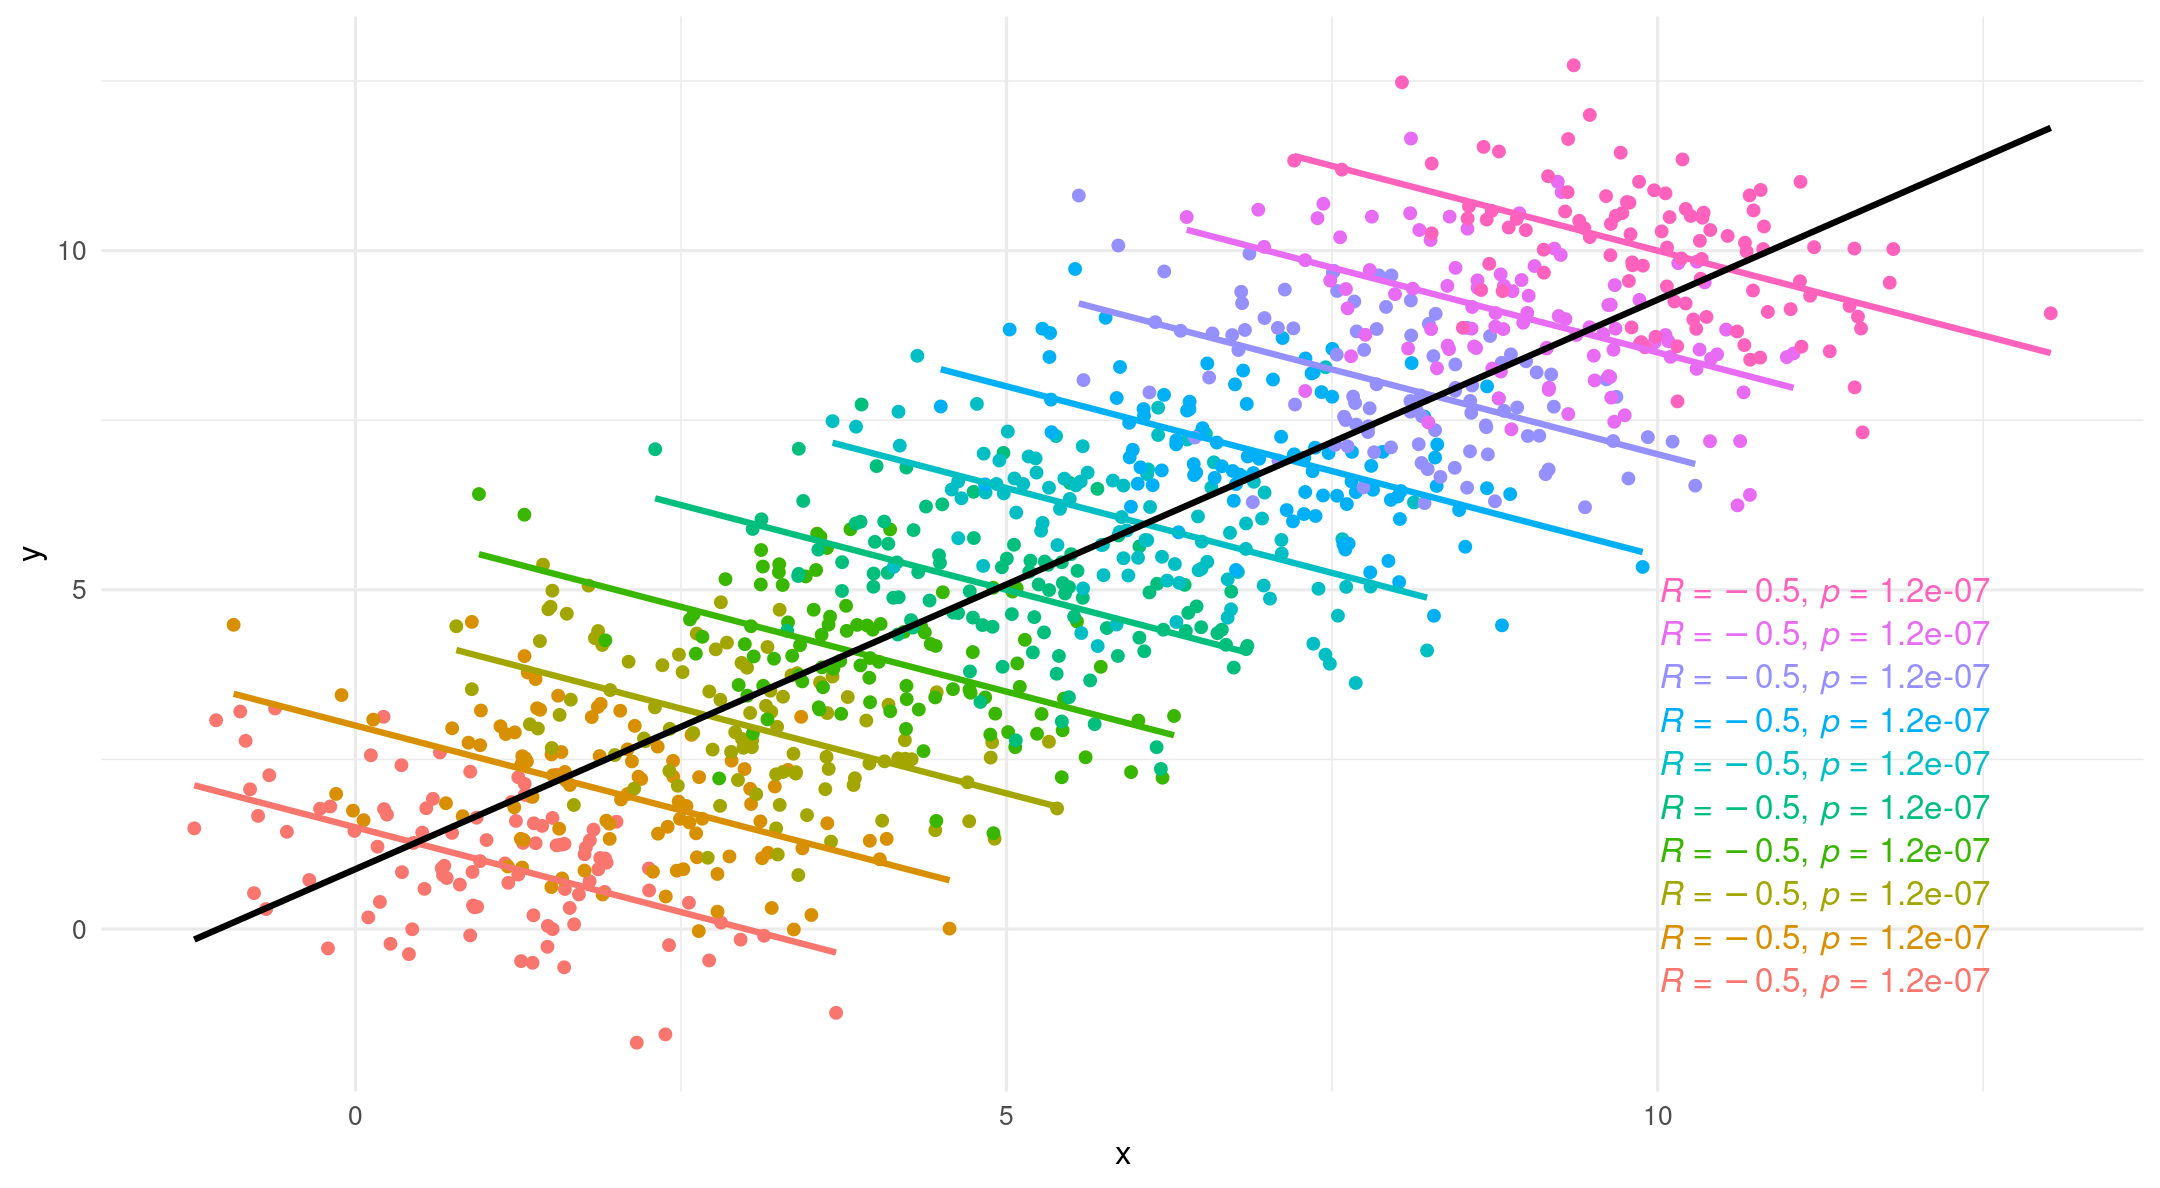
- However, if we introduce grouping we tell a slightly different story

Why multilevel modeling?
Simpson’s paradox
![]()
- A phenomenon in which a trend appears in several groups of data but disappears or reverses when the groups are combined
Why multilevel modeling?
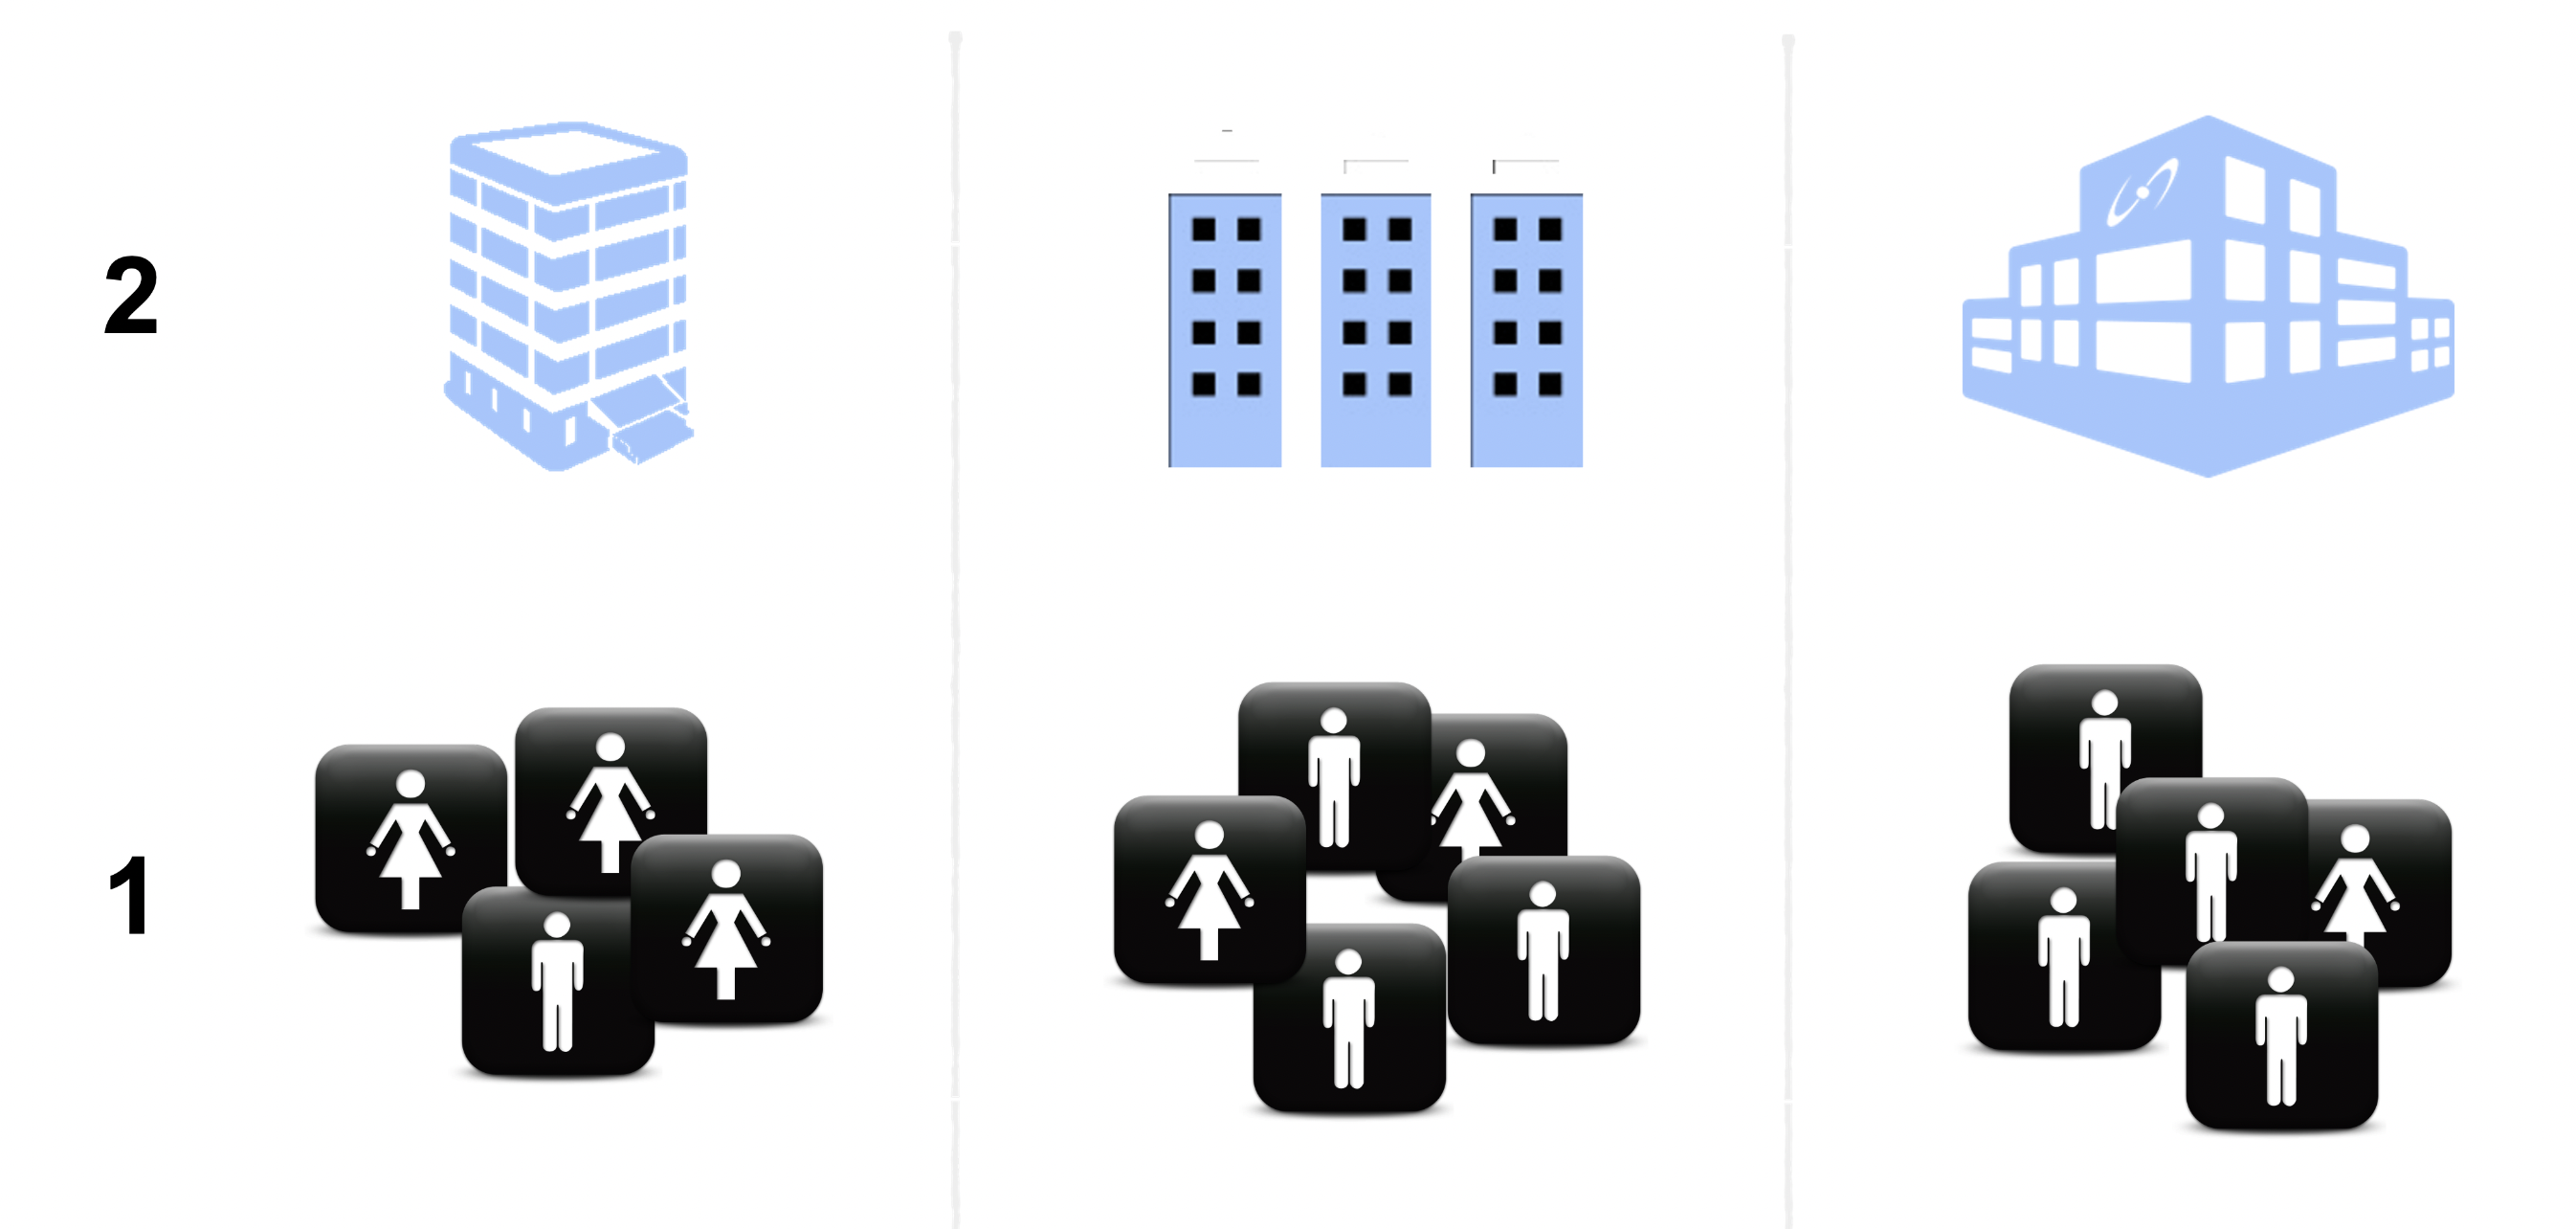
The word we live in is highly interdependent!
- Biological, psychological, social processes occur at multiple levels
Why multilevel modeling?
What is multilevel modeling?
Chelsea Parlett-Pelleriti
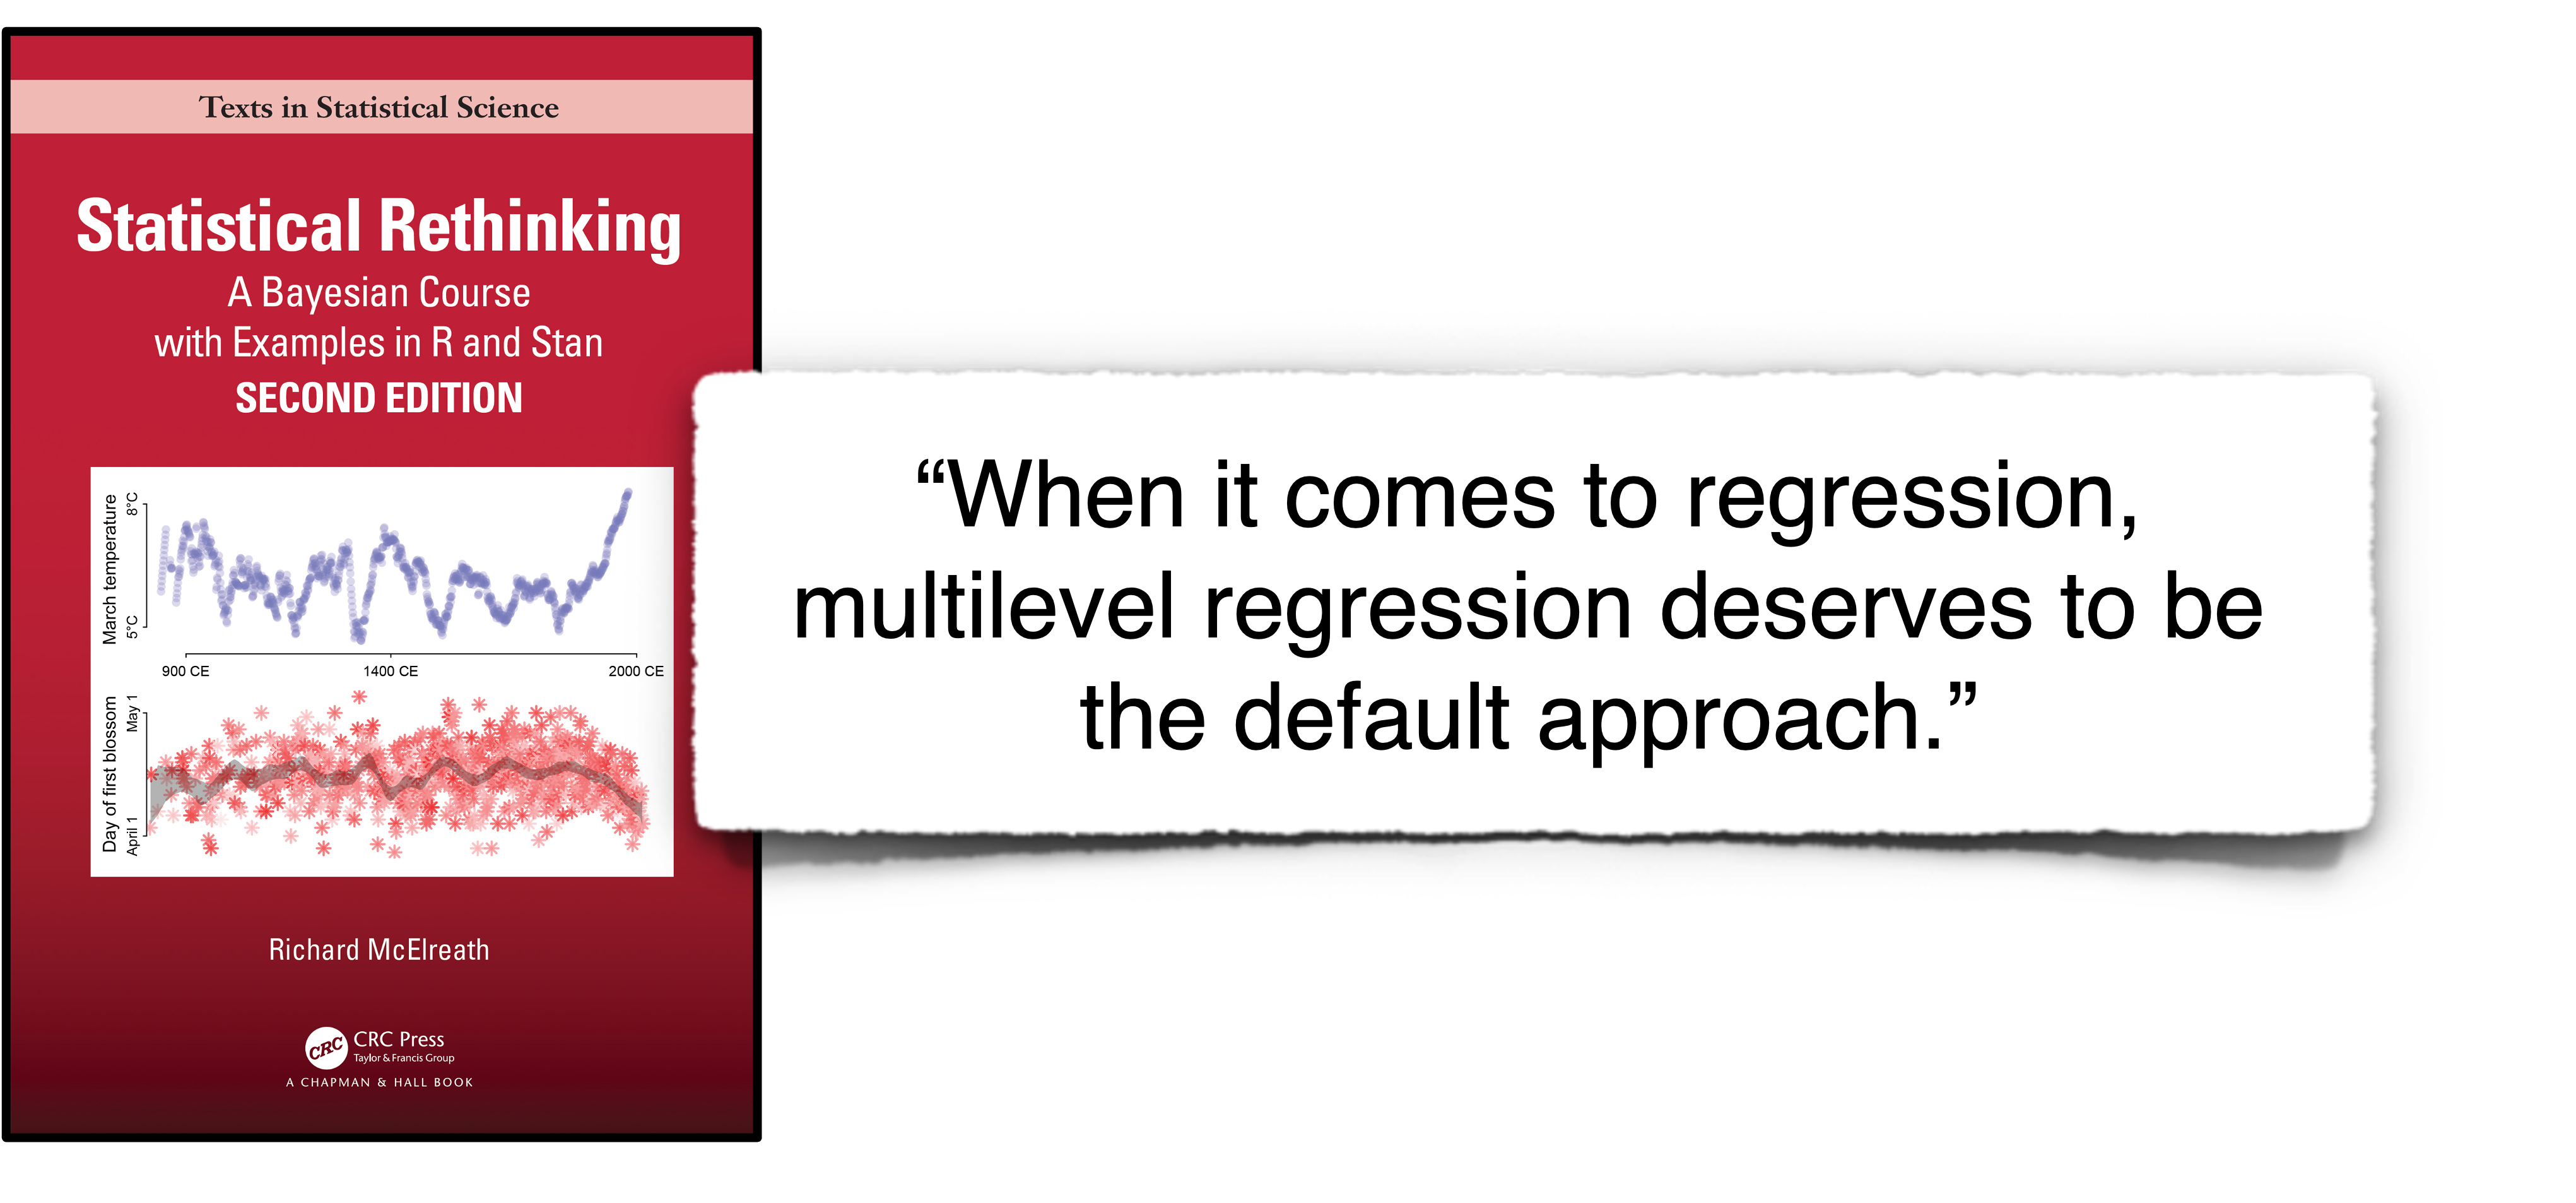
An elaboration on regression
- just extra errors!
What is multilevel modeling?
Technique that allows us deal with non-independence between data points (i.e., clustered/nested data)
- Nested data violate key assumptions of OLS
independent observationsindependent errors- Underestimates SE and increases Type 1 error
- Correct inferences!
- Nested data violate key assumptions of OLS
Explicit partitioning of the variance
Within (intra-group differences)
Between (inter-group differences)
What is a “hierarchy?”
Clustering = Nesting = Grouping = Hierarchies
Key idea: More than one dimension sampling simultaneously
“Nested” designs
Repeated-measures and longitudinal designs
Any complex mixed design
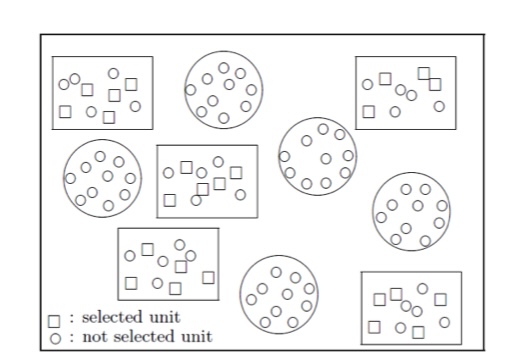
Nested designs

Two-level Hierarchy
- Nested designs

For now we will focus on data with two levels:
- Level one: most basic level of observation
- Level two: groups formed from aggregated level-one observation
Three-level Hierarchy

Crossed vs. nested designs
Crossed designs (sometimes called cross-classified)
- When lower units do not belong to only one higher level unit
Repeated designs
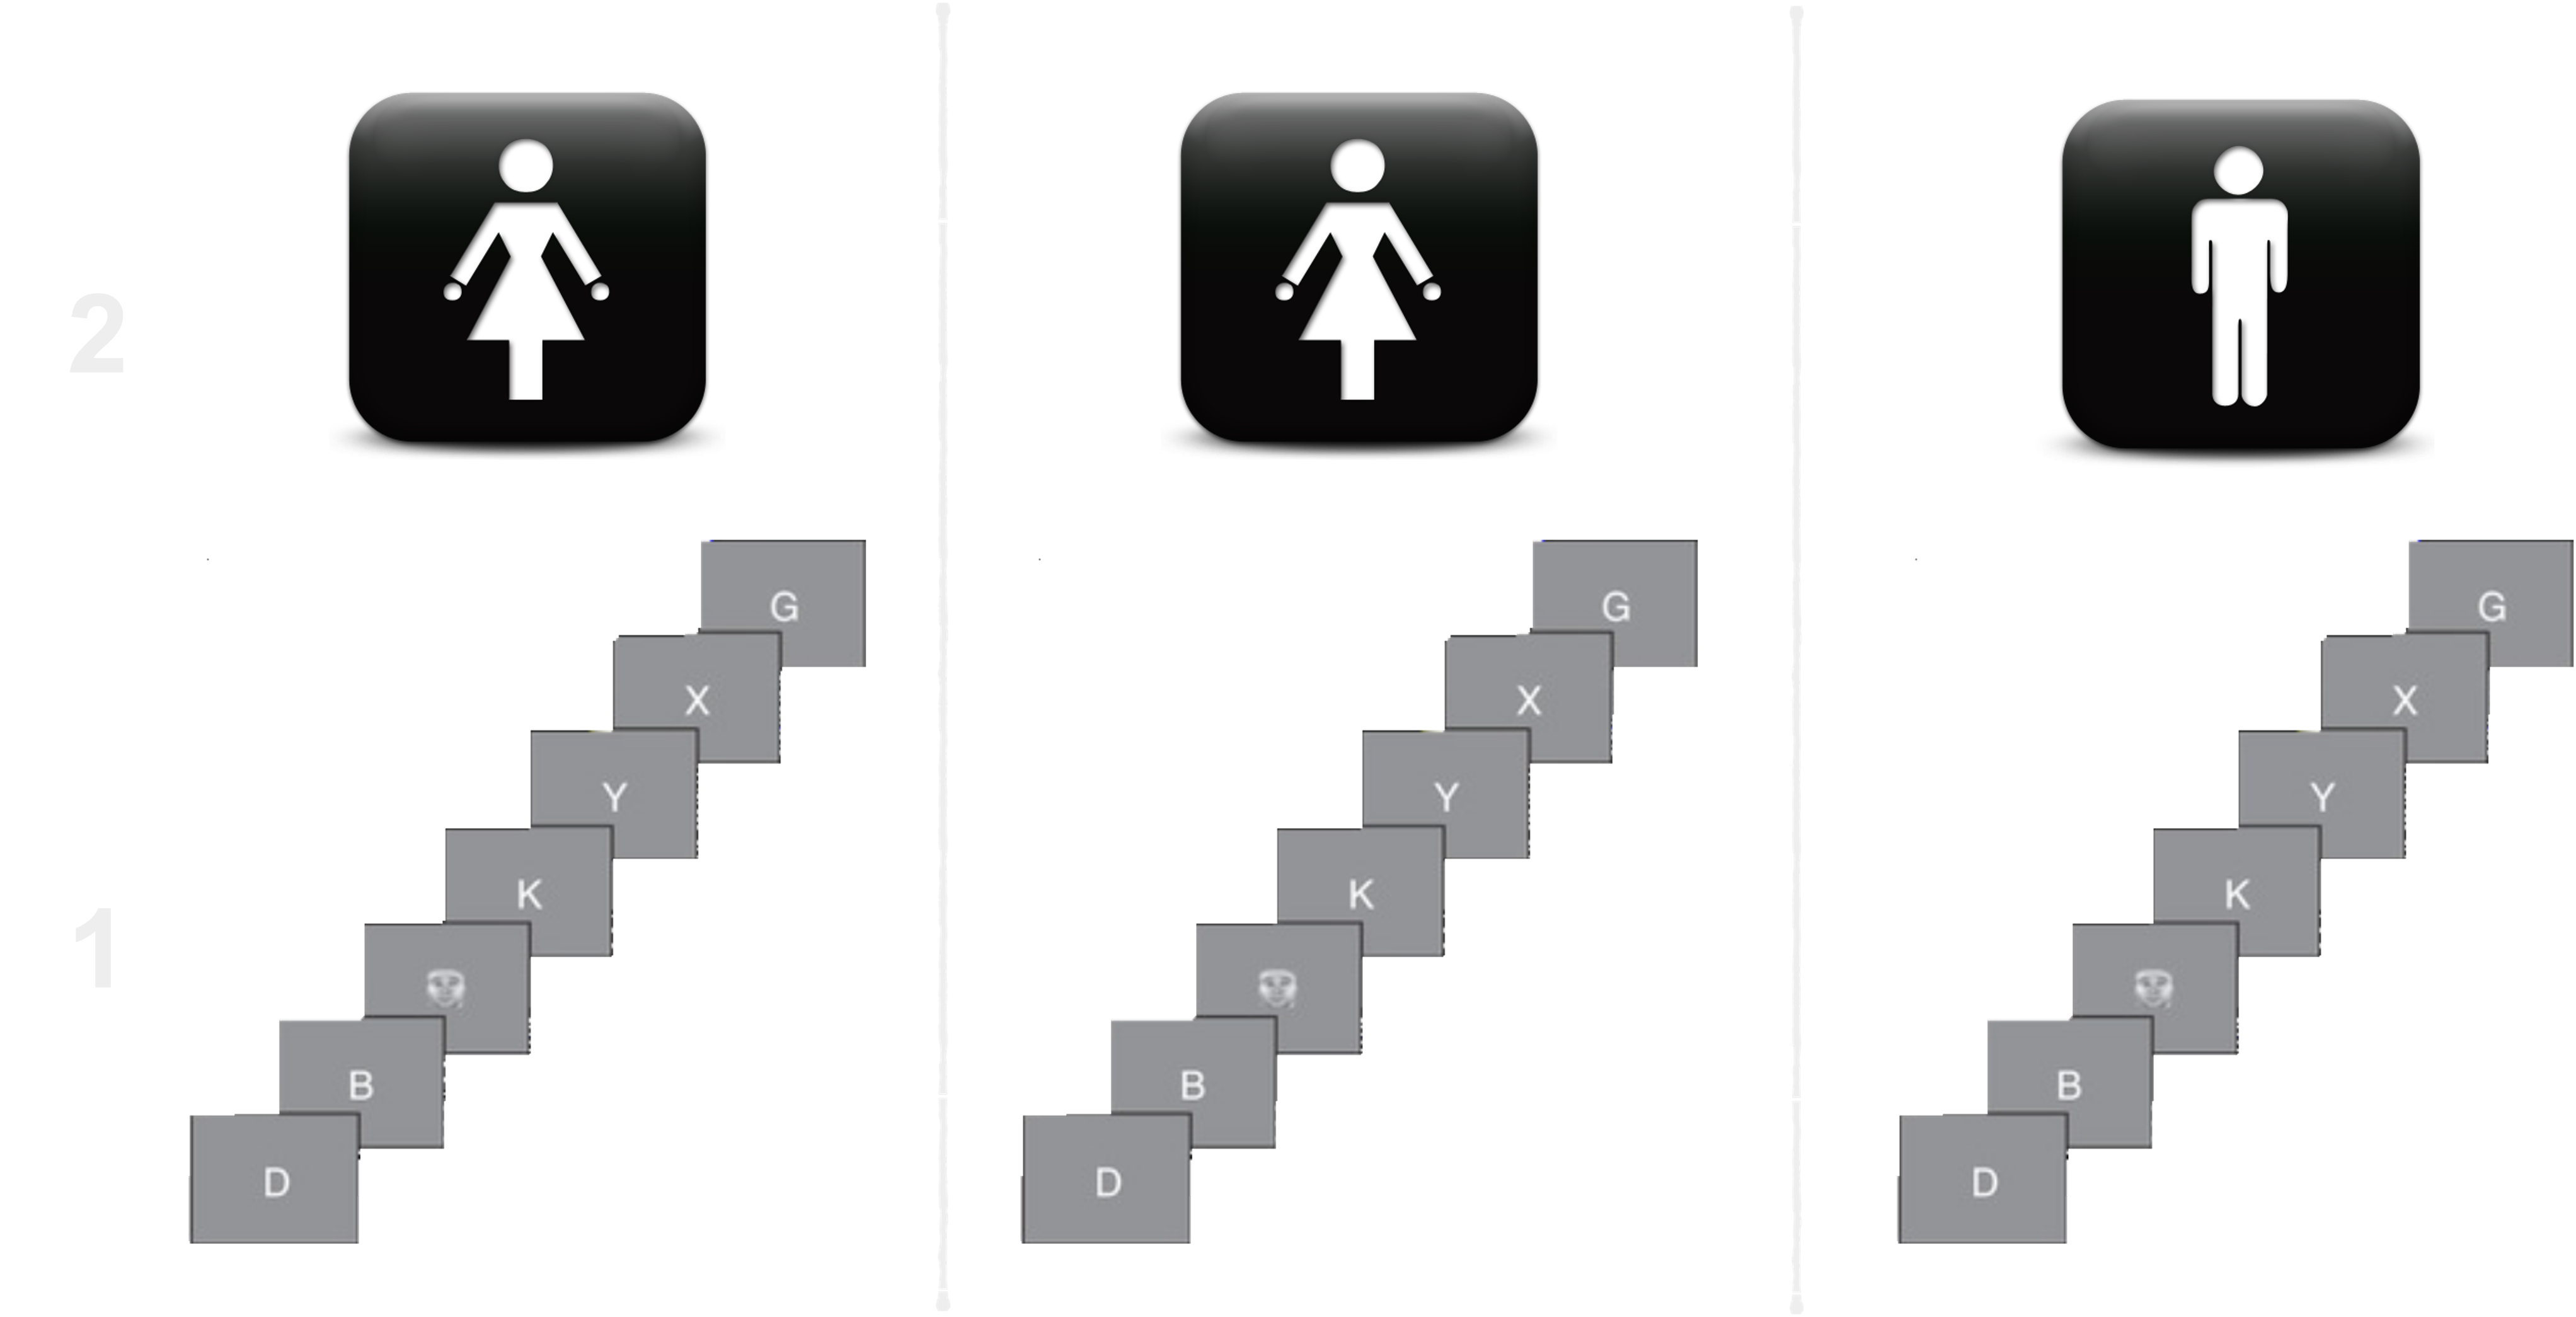
Repeated designs
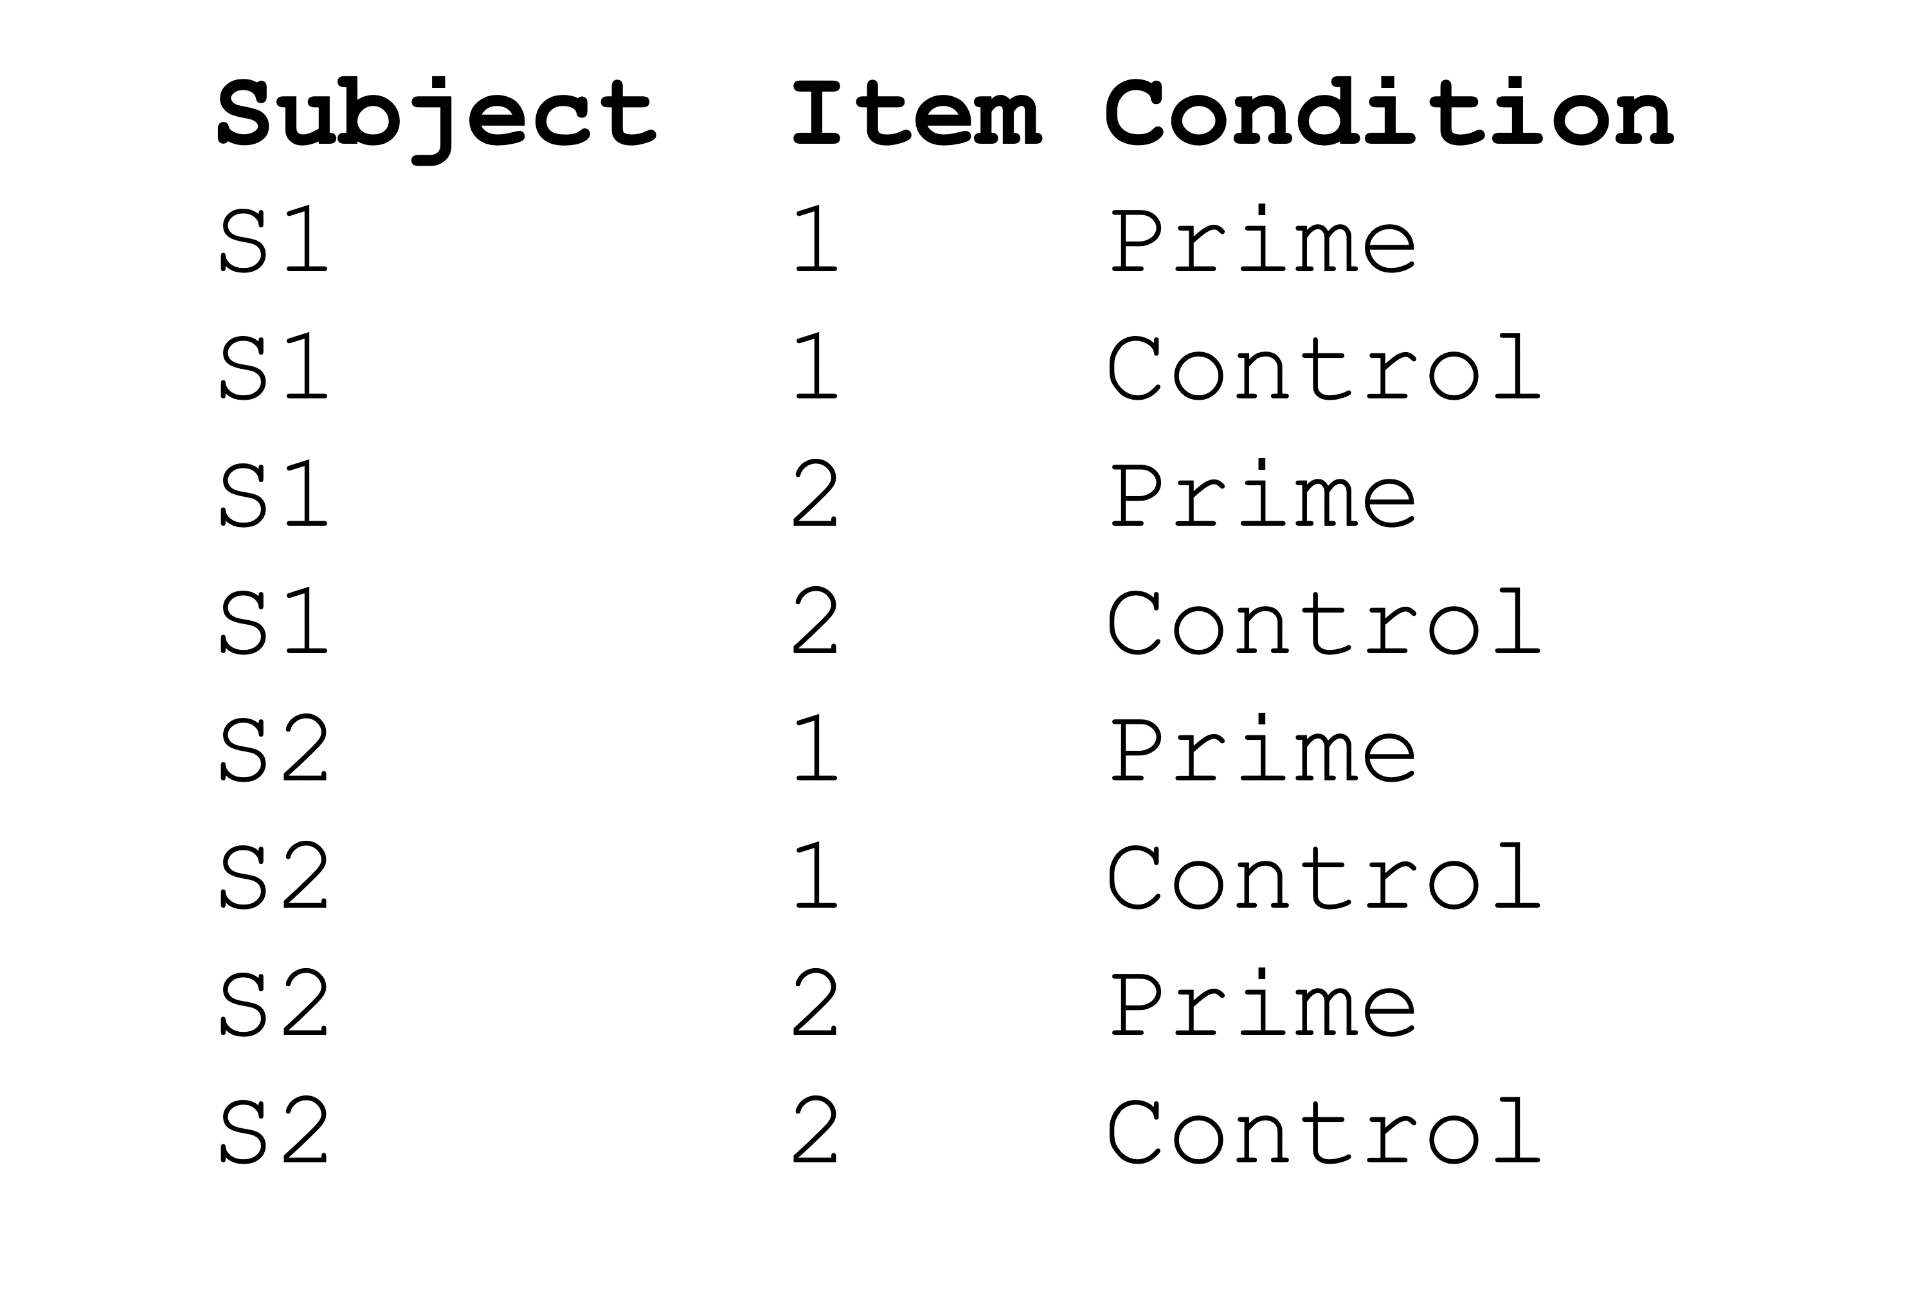
Repeated designs
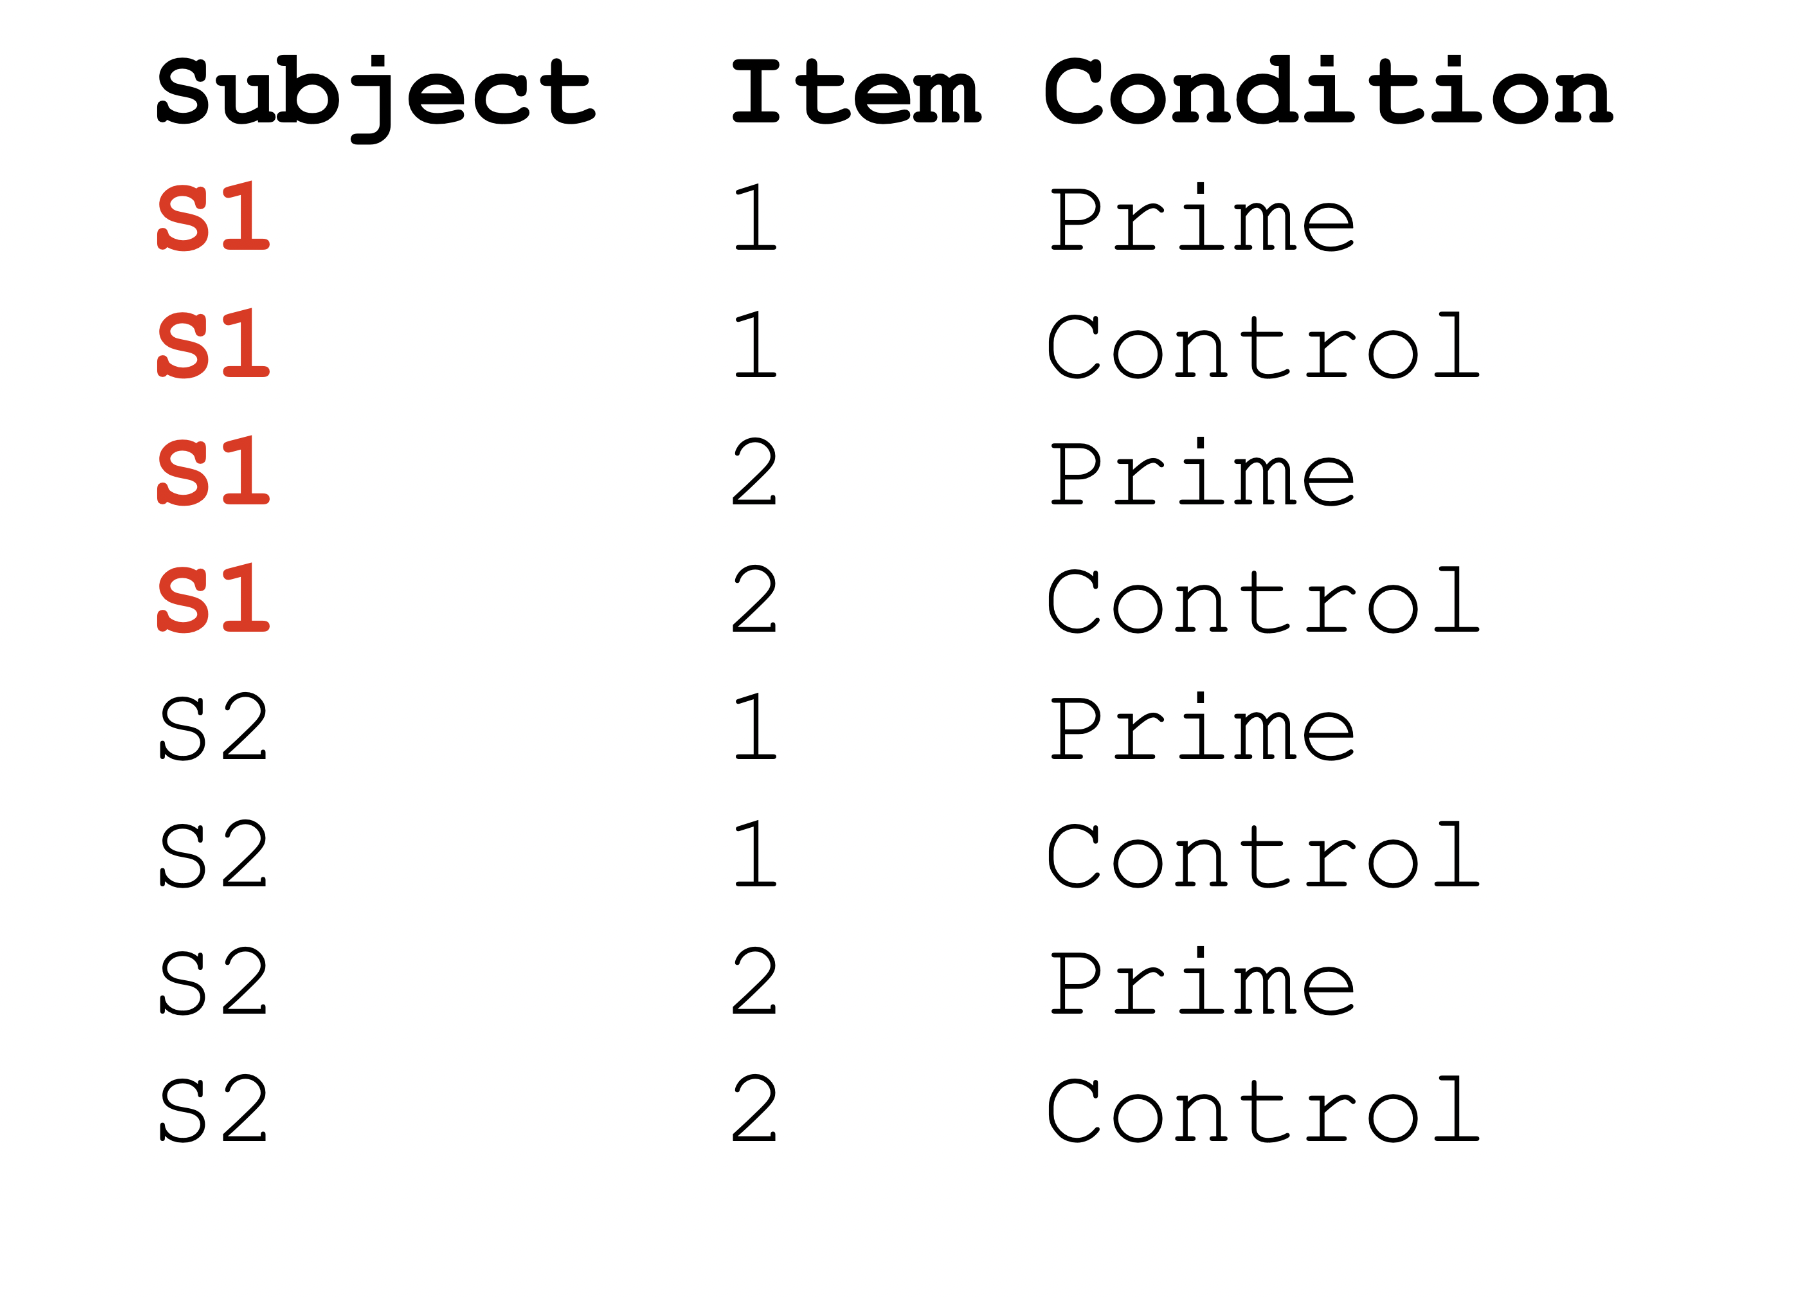
Repeated designs
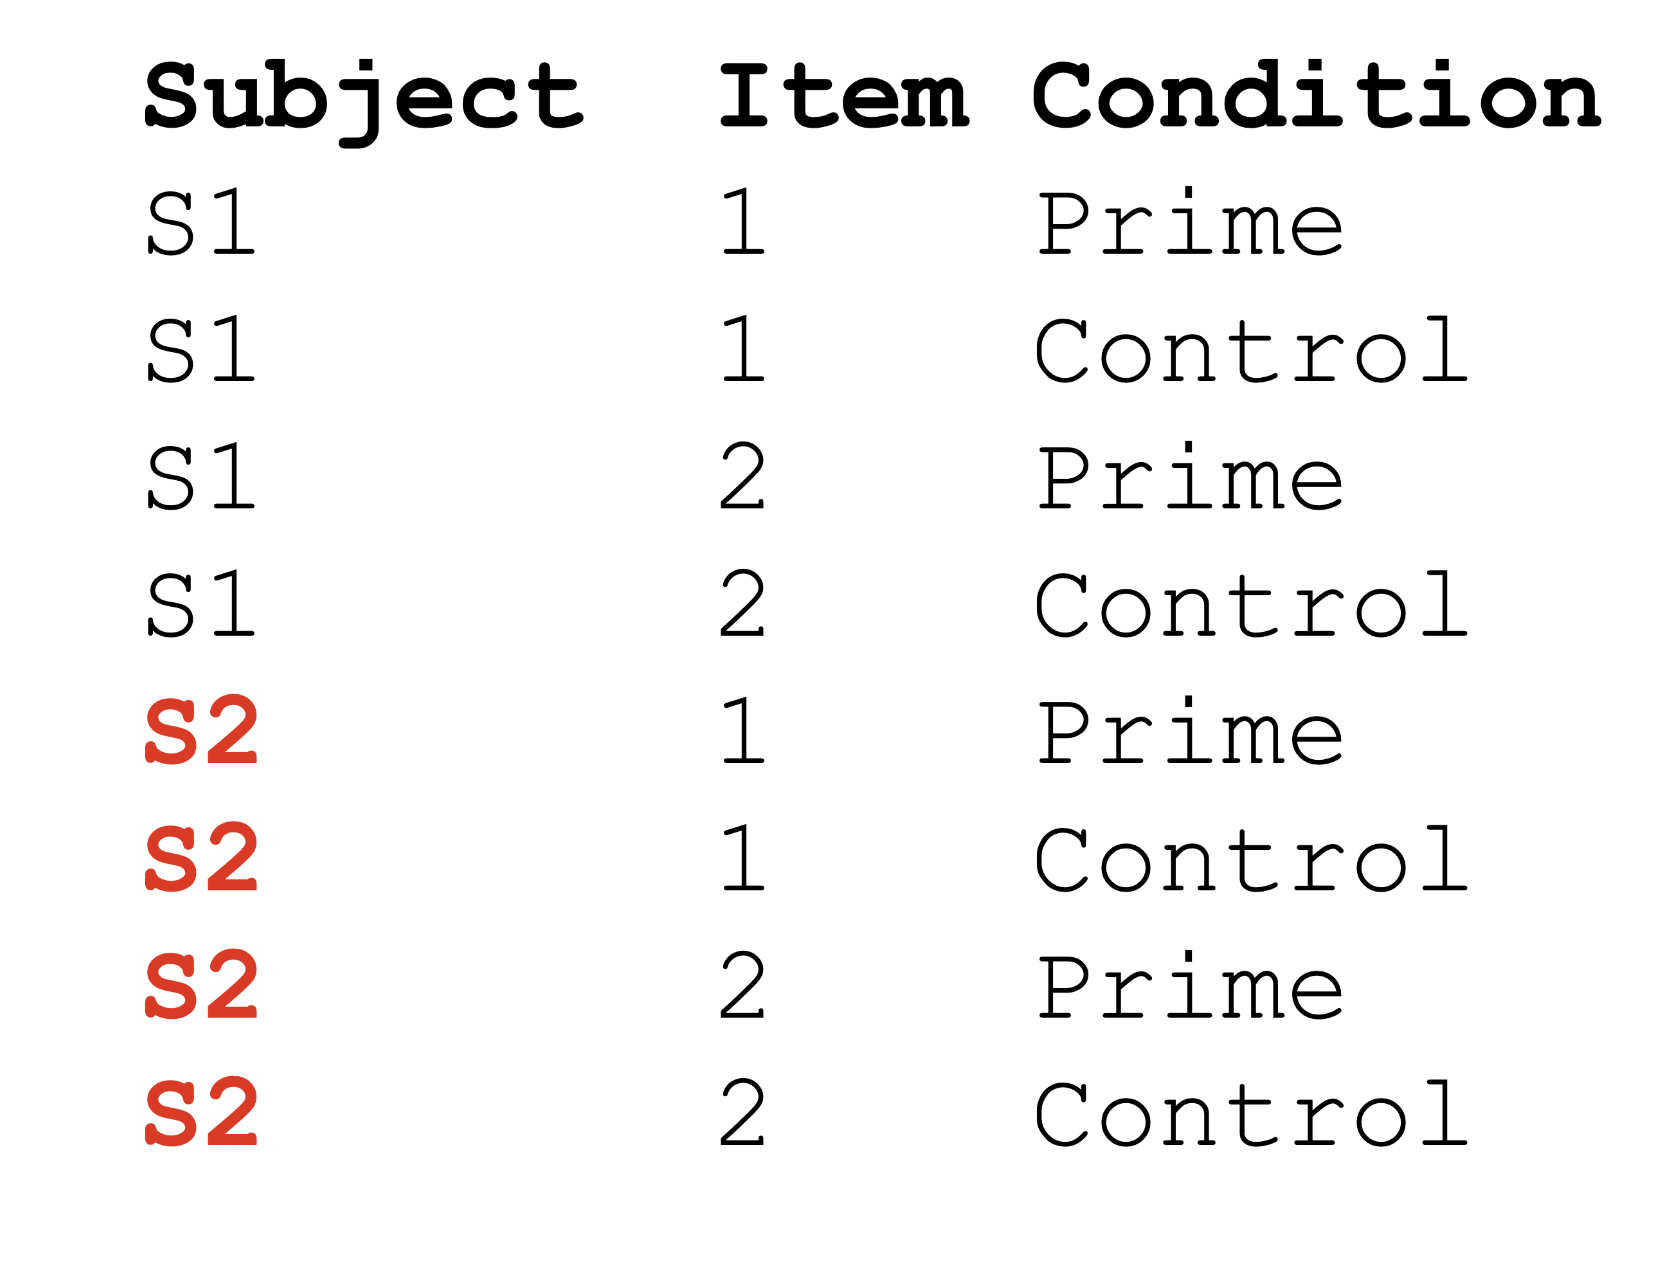
Repeated designs
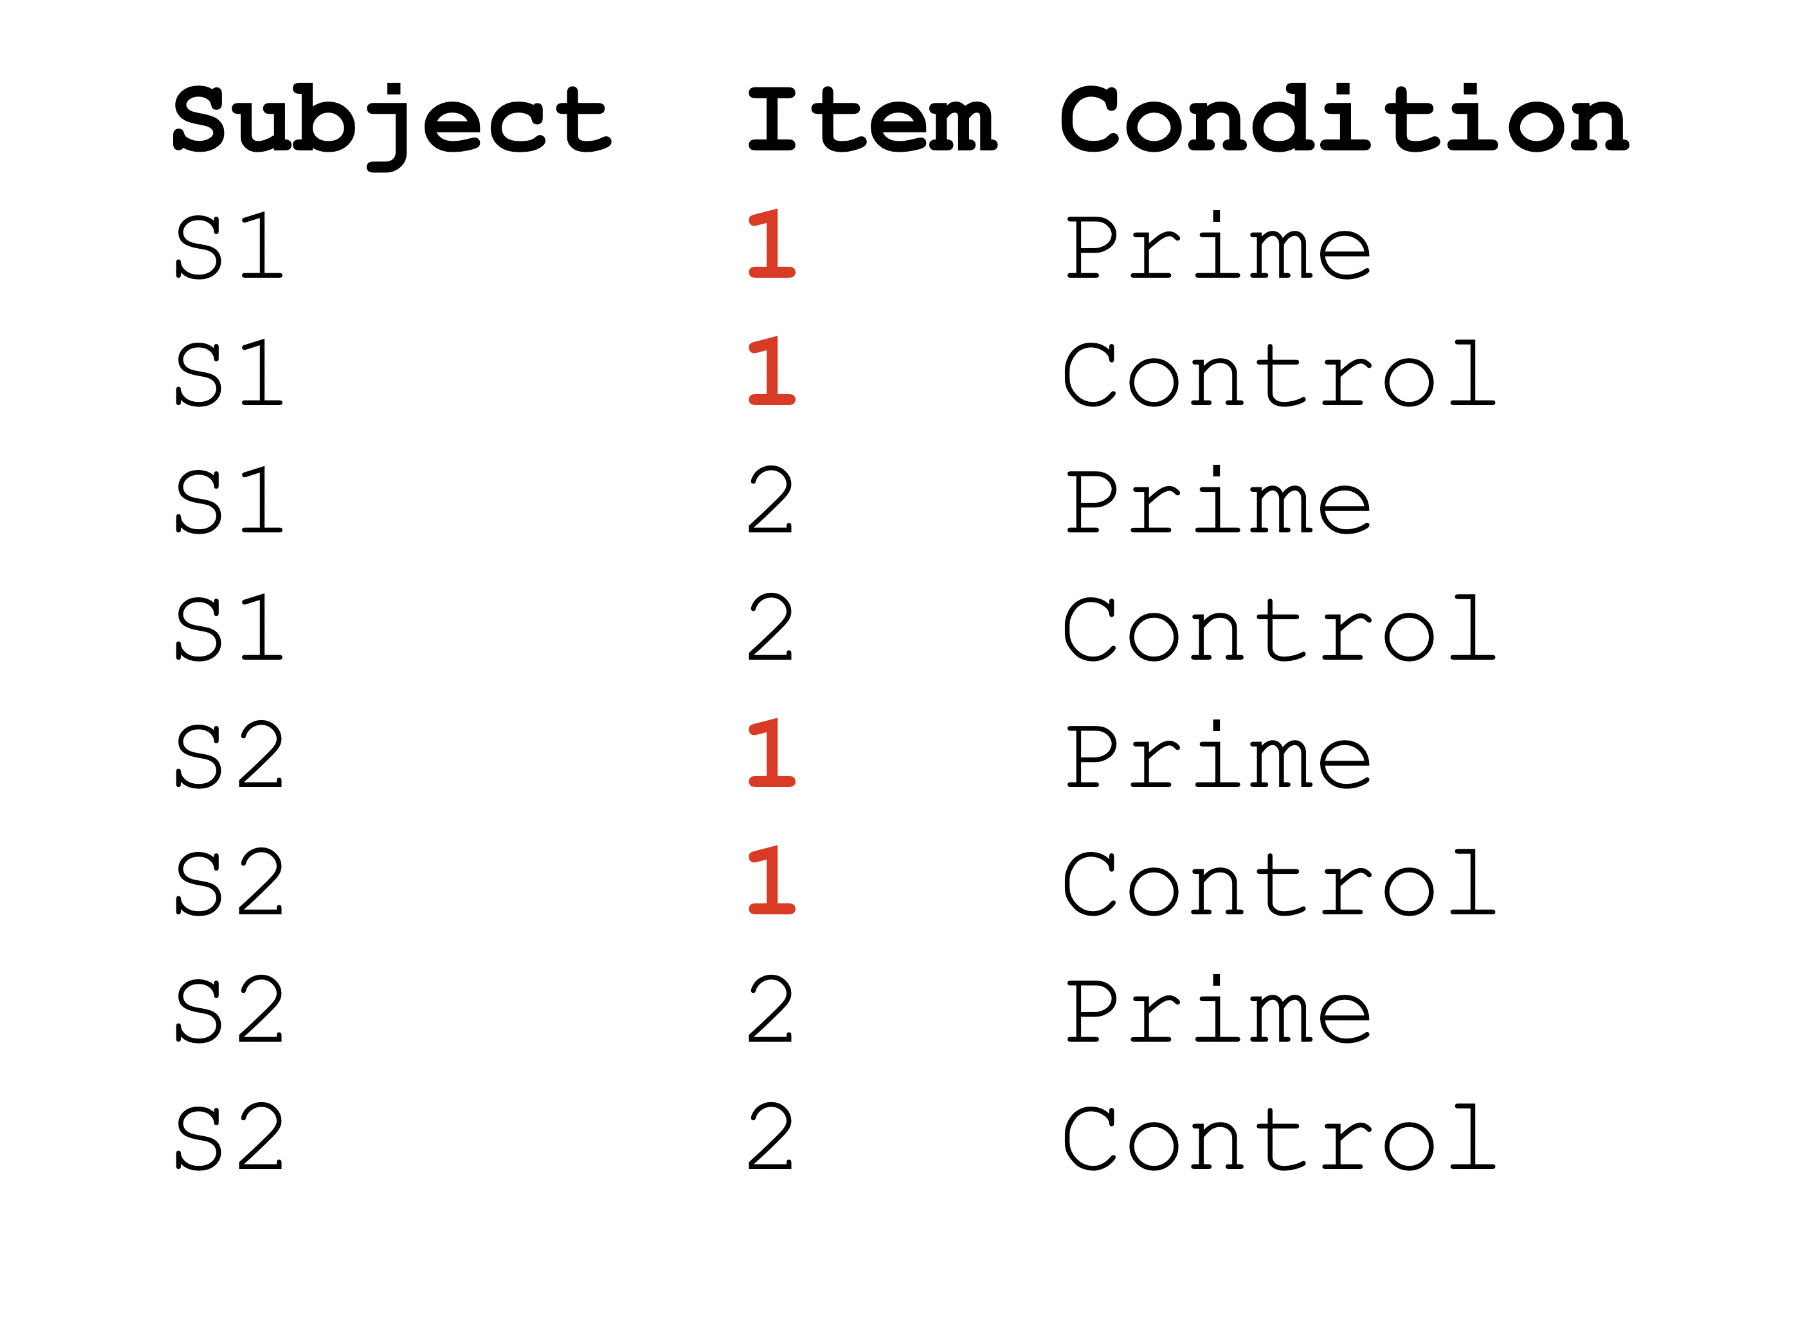
Repeated designs
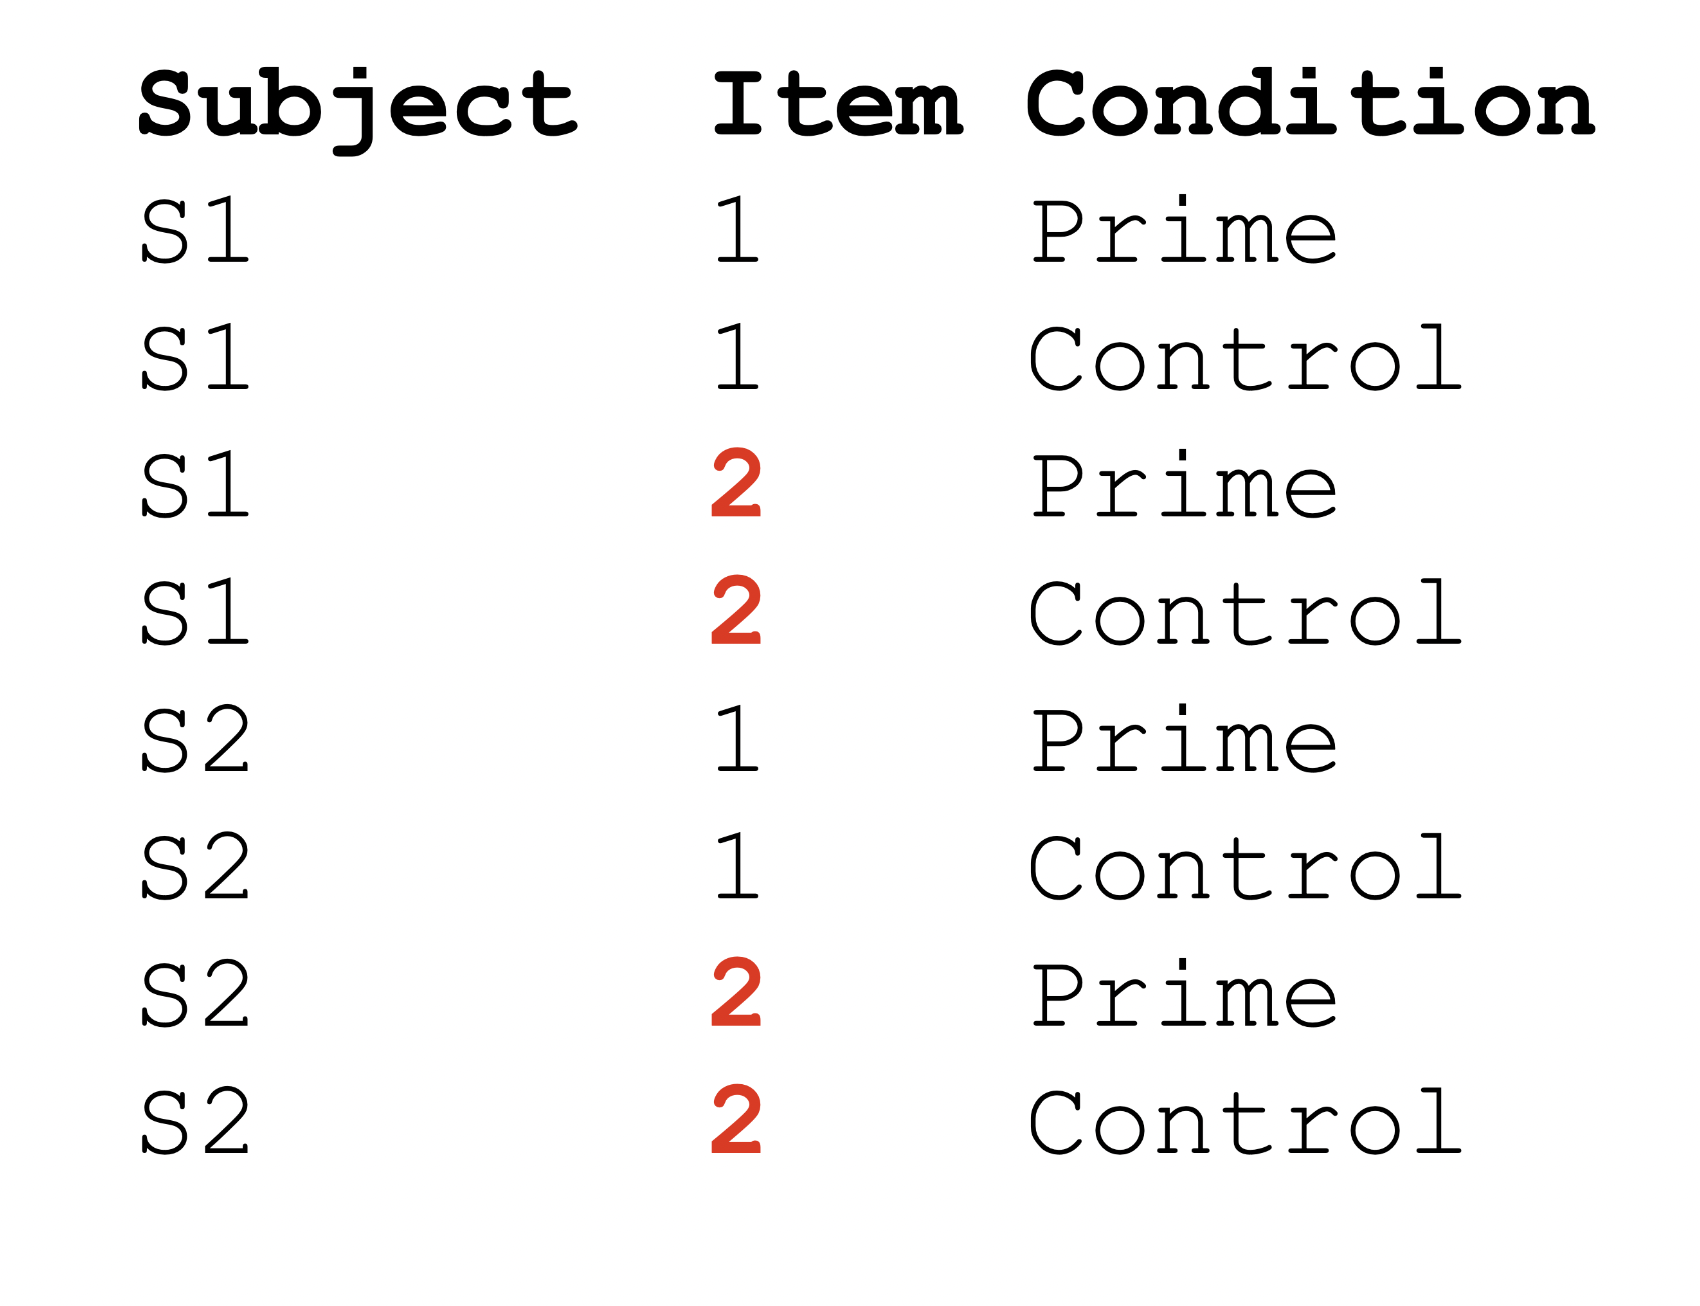
Longitudinal designs

Test your knowledge
Radon is a carcinogen – a naturally occurring radioactive gas whose decay products are also radioactive – known to cause lung cancer in high concentrations. The EPA sampled more than 80,000 homes across the U.S. Each house came from a randomly selected county and measurements were made on each level of each home. Uranium measurements at the county level were included to improve the radon estimates.
- What is the most basic level of observation (Level One)?
- What are the group units (Level Two, Level Three, etc…)?
Multilevel models are awesome!
Why MLM is Awesome
Classic analysis:
- Aggregate to level of the group (e.g., with means)
Drawback of classic analysis:
- Loss of resolution!
- Loss of power!
MLM Approach:
- Deaggregation (keep all the data)
Why MLM is Awesome
Classic Analysis:
- Repeated-measures ANOVA
Drawback of this approach:
Missing data
- Must exclude entire people OR, you can interpolate missing data
MLM Approach:
- Can analyze all the observations you have!
Why MLM is Awesome
Classic Analysis:
- Repeated-measures ANOVA
Drawback of ANOVA:
- Only use categorical predictors
MLM Approach:
- Can use any combo of categorical and continuous predictors!
Why MLM is Awesome
- Interdependence
- You can model the relationships between cases (regression for repeated observations)
- Missing data
- Uses ML for missing data
- Power
- Deaggregated data
- Take into account within and between variance
- Flexibility

Multilevel models
When to use them:
Nested designs
Repeated measures
Longitudinal data
Complex designs
Why use them:
- Captures variance occurring between groups and within groups
What they are:
- Linear model with extra residuals
Why not use MLM?
Dont really care about variance (it is just a nuisance variable)
- Use GEEs (generalized estimating equations)
- Clustered standard errors
Data is not actually interdependent
- Test with ICC (Monday)
Small number of groups/clusters
You only have a between-subjects design
Important Terminology
Jumping right in
Words you hear constantly in MLM Land:
- Fixed effects
- Random effects
- Random factors
- Random intercepts
- Random slopes
What do they all mean?
Fixed and random effects
Two sides to any model
\[ y_i = \color{blue}{b_{0_{\text{(intercept)}}} + b_{1_{\text{(slope)}}} x_i} + e_{i_{\text{(error)}}} \]
Model for the means (fixed part):
Fixed effect (constant effect):
- Population-level (i.e., average) effects that should persist across clusters/experiments
Note
- What you are used to caring about for testing hypotheses
- Our predictor variables (can be continuous or categorical)
Fixed and random effects
- Model for the variance (random part):
\[ y_i = {b_{0_{\text{(intercept)}}} + b_{1_{\text{(slope)}}} x_i} + \color{red}{e_{i_{\text{(error)}}}} \]
Uncorrelated with fixed part
Variation around the expected values
Normal distributed ~ \(N(\mu,\sigma)\)
- In MLM multiple “piles of variance” or residual terms
Random factors and random effects
Random factors:
Represent higher level grouping variables
- A random sample of an infinite number of possible levels
Note
Can only be categorical!
Random factors vs random effects
The random factor is your clustering variable:
Participants 🧑🤝🧑
Schools 🏫
Words
Pictures 🖼️
Random factors vs random effects
Random effects:
How random factors are allowed to vary
Random intercept (most common) : \(U_{0j}\)
- Each level-2 cluster has its own average level-1 outcome
Random slope: \(U_{1j}\)
Each level-2 cluster has its own coef for the effect of a predictor on the outcome
- You have a choice about whether or not to allow your Level 1 intercept and slopes to have variability
Is it a random or fixed factor?
Should my variable be fixed or random?
If it is continuous, has few levels (<5), or is an experimental manipulation
- Fixed
Want to estimate variance at each level of factor?
- Fixed
Want a general estimate of variance of factor?
- Random
What is random and what is fixed?
Scenario: Investigating how student performance is influenced by teaching methods and individual student characteristics across different schools.
Data Collected: student socio-economic status (SES), teaching method used (e.g., traditional, modern), and school ID
What is fixed?
What is random?
Specifiying MLMs
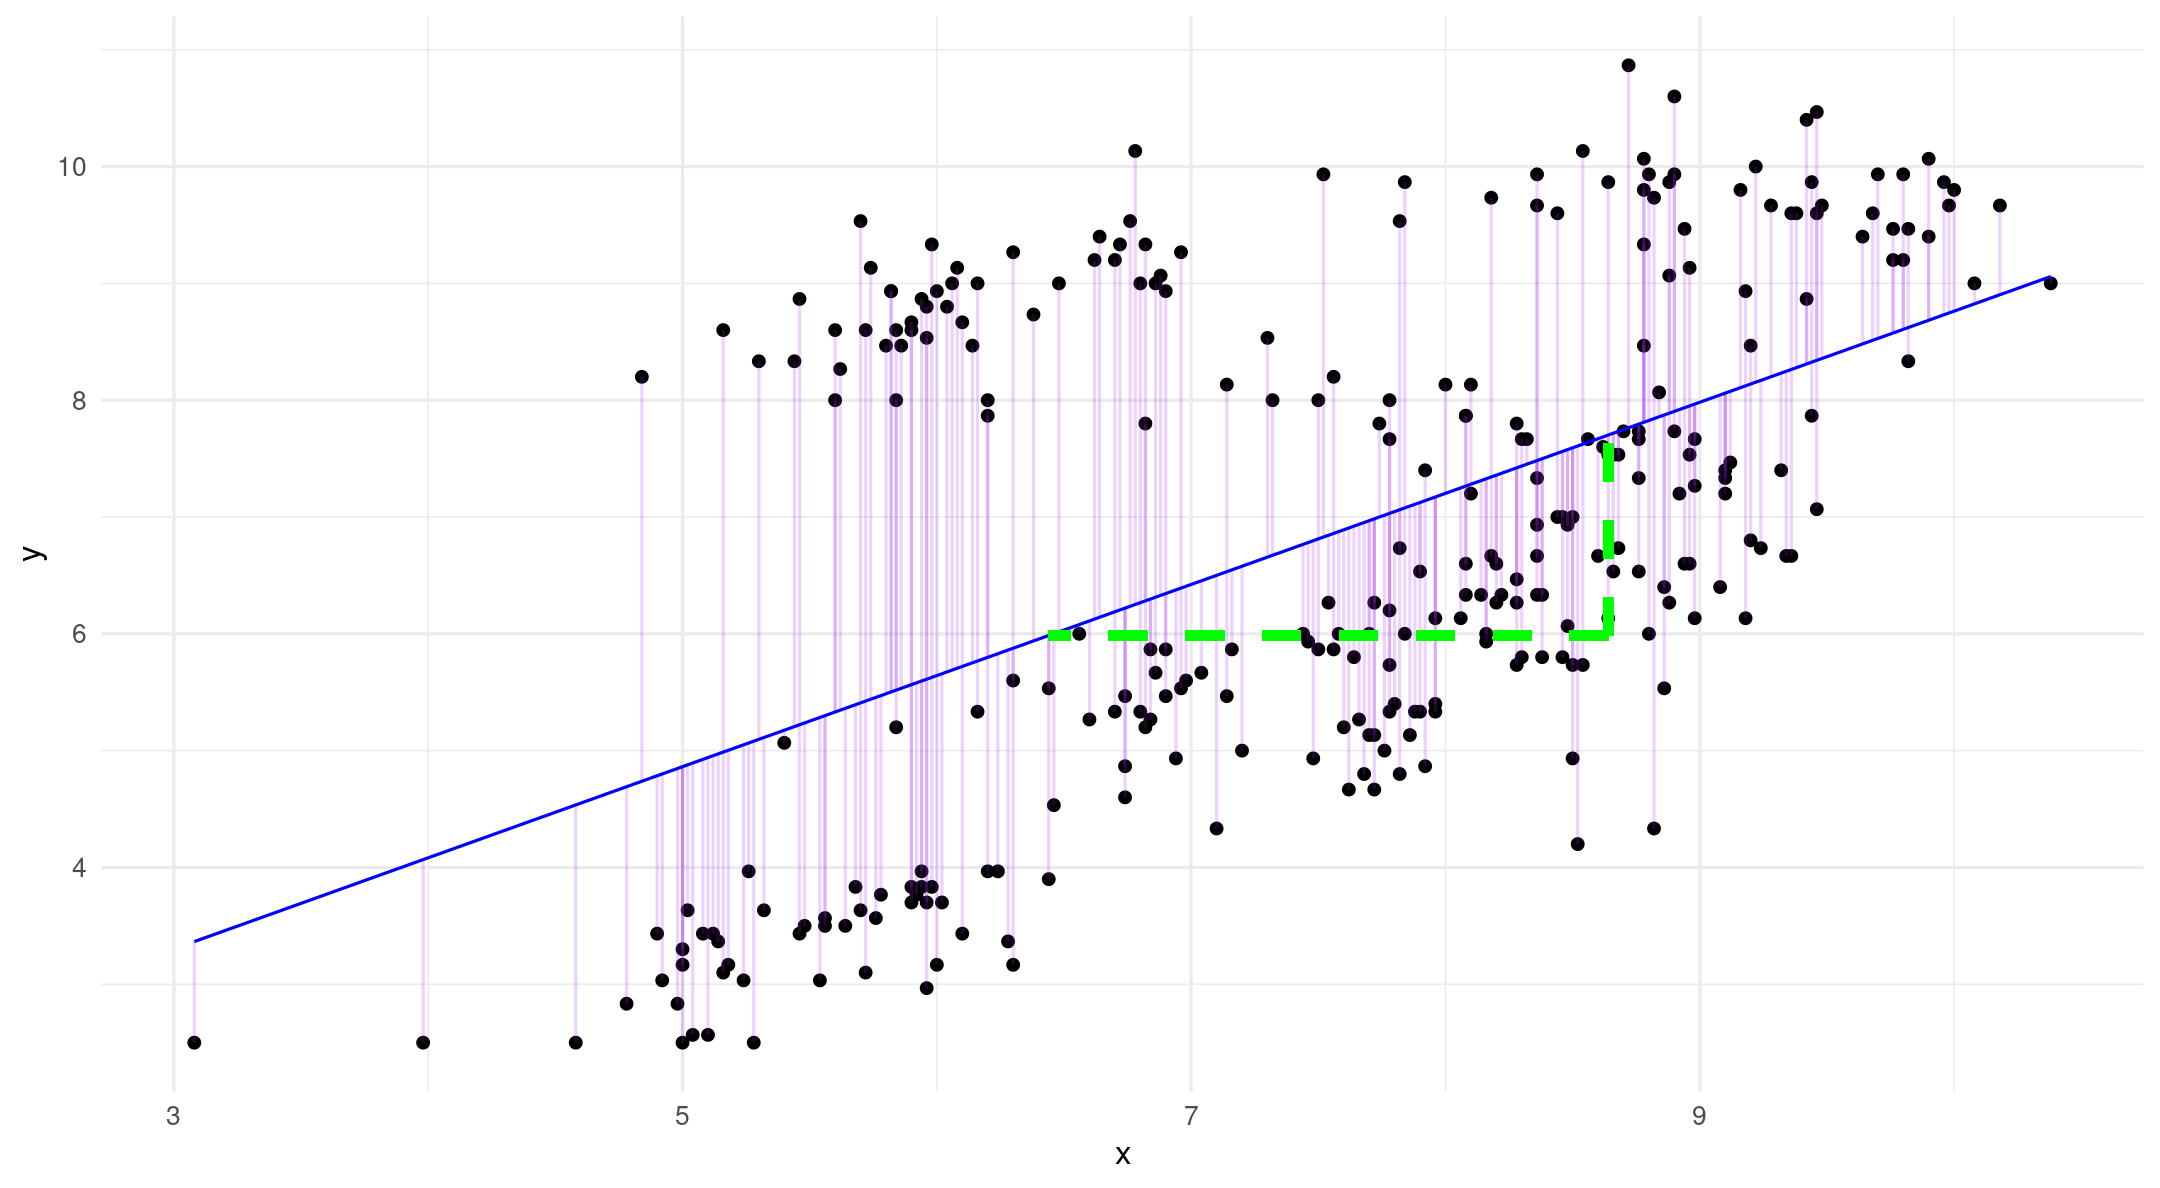
Single-level (fixed) regression
Blue = fixed
Red = random
\[y_i = \color{blue}{b_{0_{\text{(intercept)}}} + b_{1_{\text{(slope)}}} x_i} + \color{red}{ e_{i_{\text{(error)}}}}\]
\[ e_{i_{\text{(error)}}} = y_i - \hat{y}_i \]
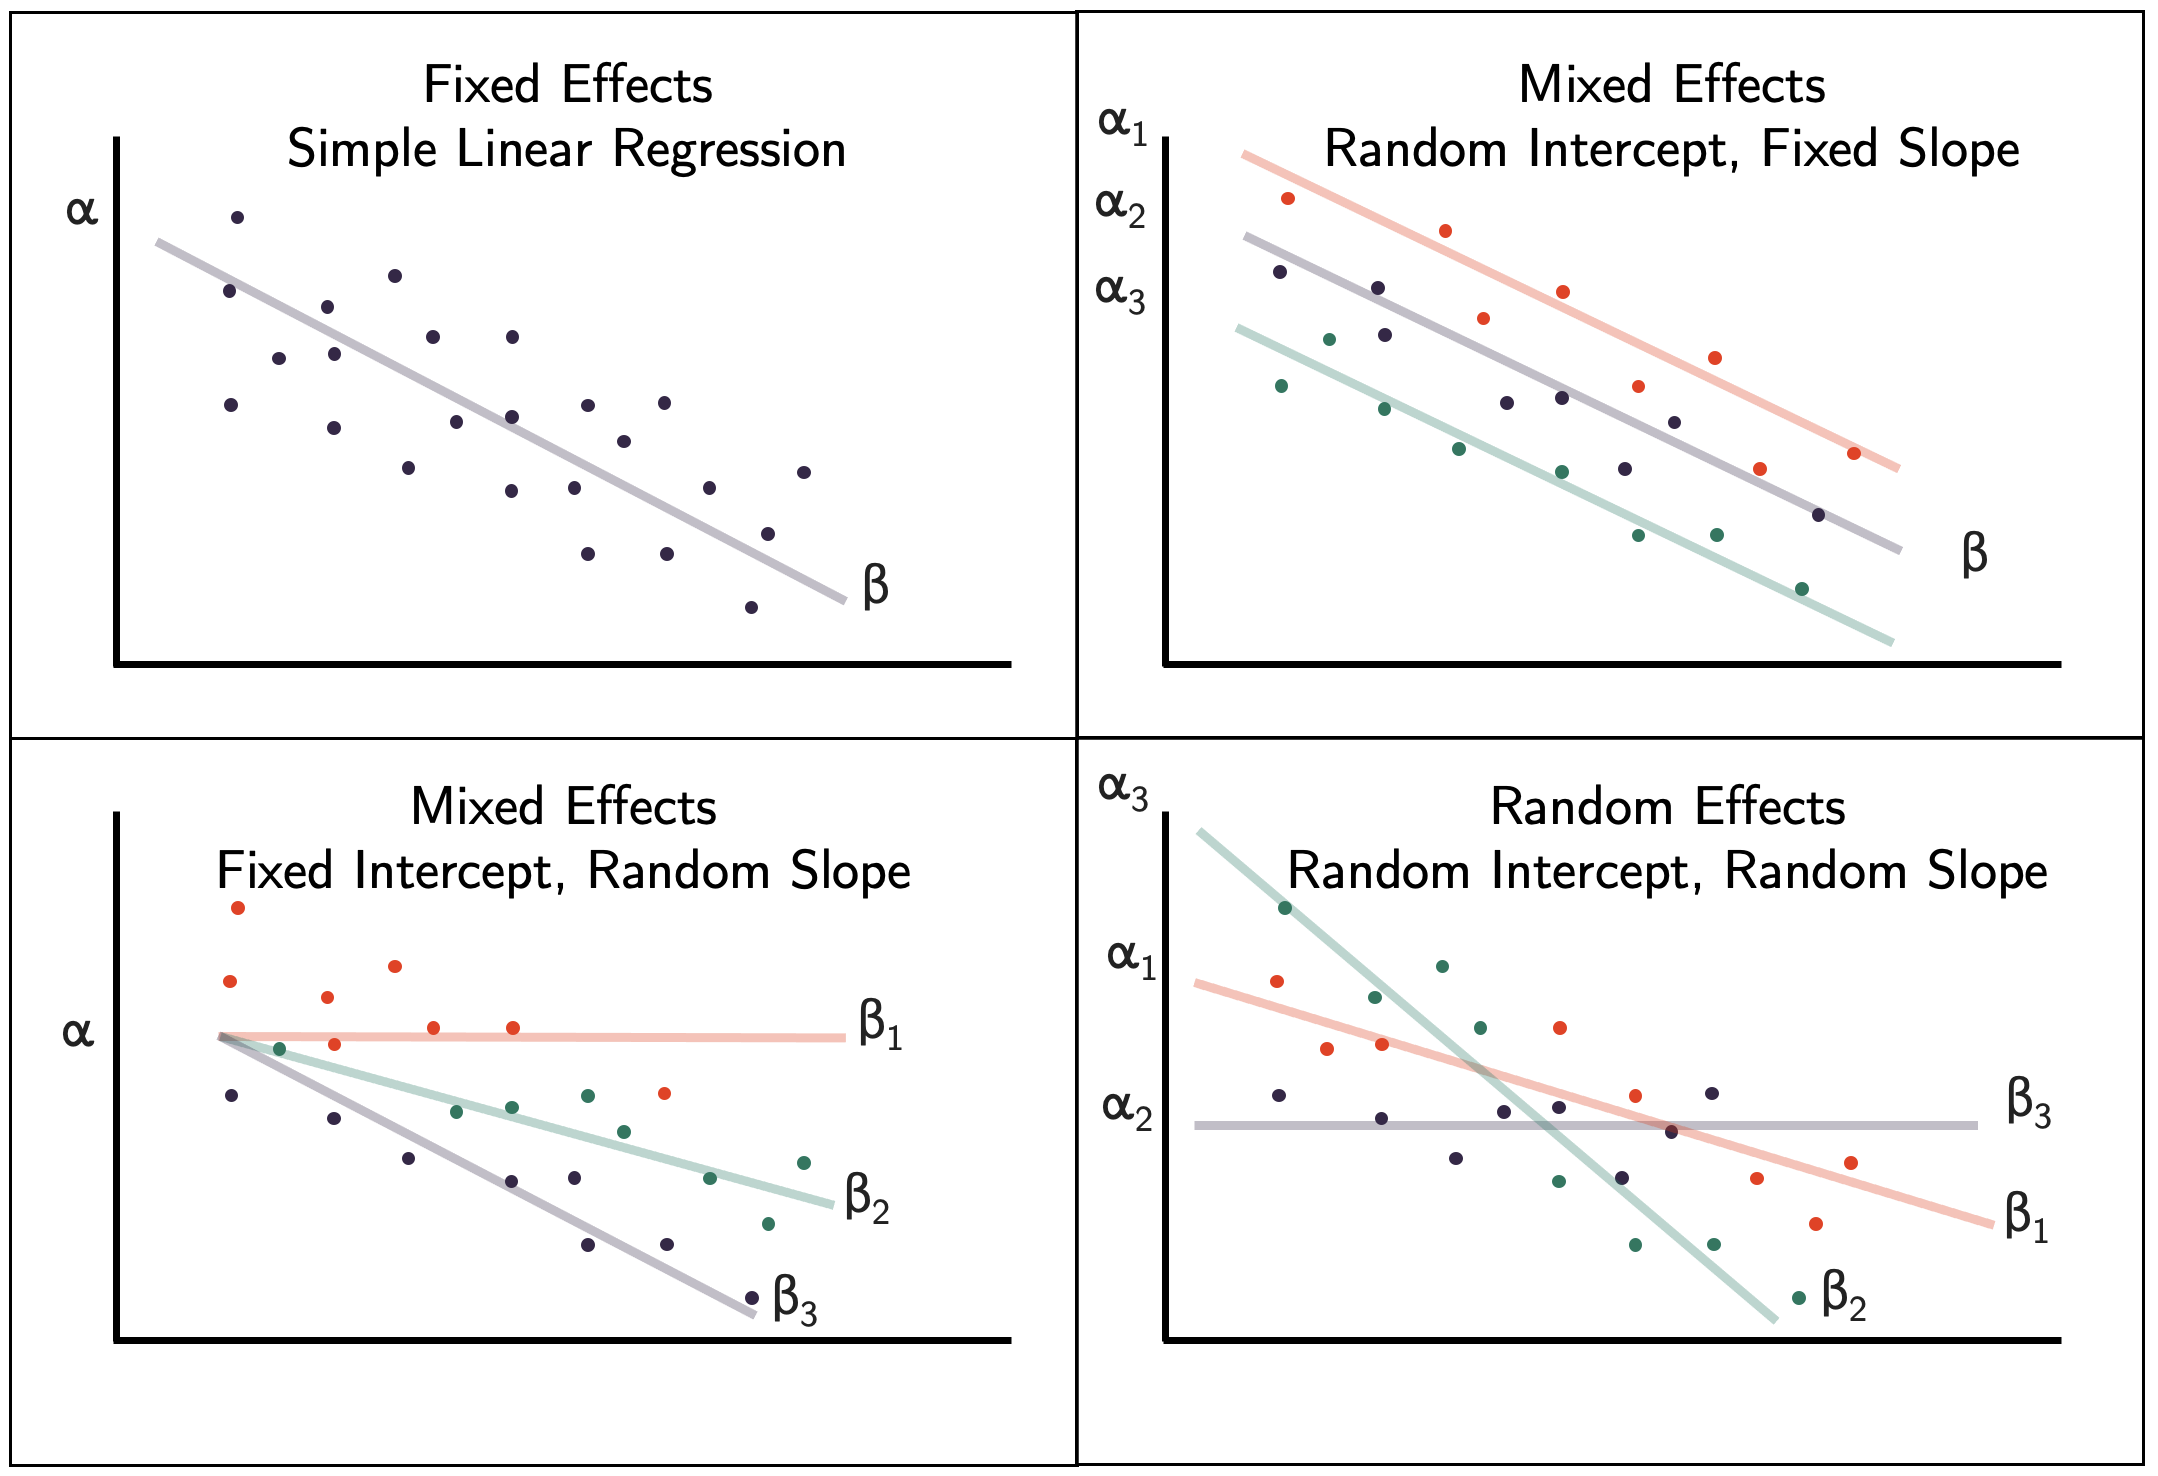
Random intercept
- Varying starting point per higher level/group variable
\[ y_{ij} = (\color{blue}{b_{0j_{\text{(intercept)}}}} + \color{red}{U_{0j_{\text{(random intercept)}}}}) + \color{blue}{b_{1_{\text{(slope)}}} x_{ij}} + \color{red}{e_{ij_{\text{(error)}}}} \]
\[ U_{0j} = b_{0j} - b_0 \]
- Between-group variation
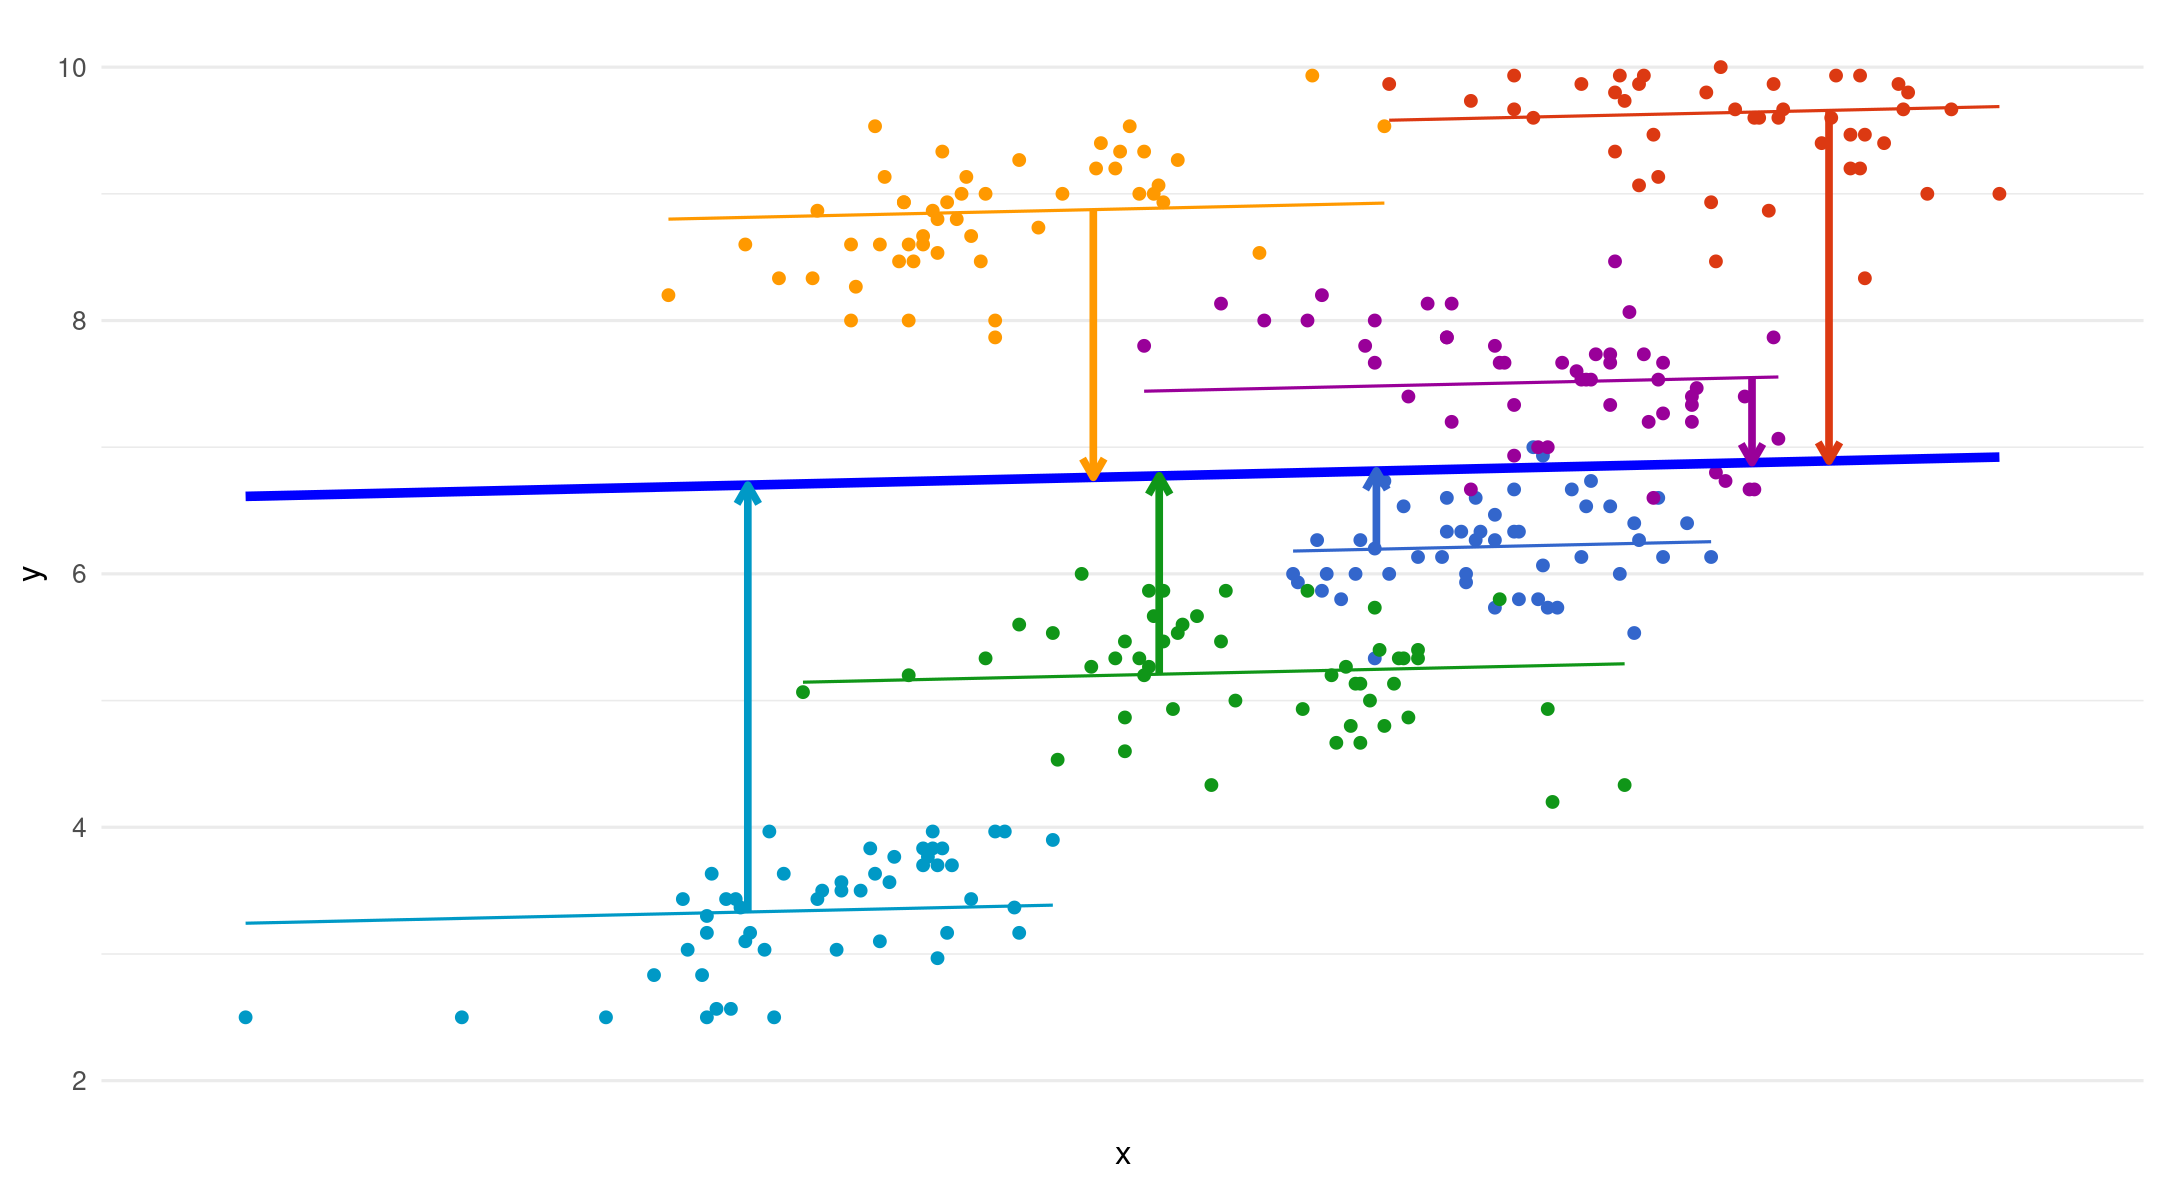
i = individual observation j = group
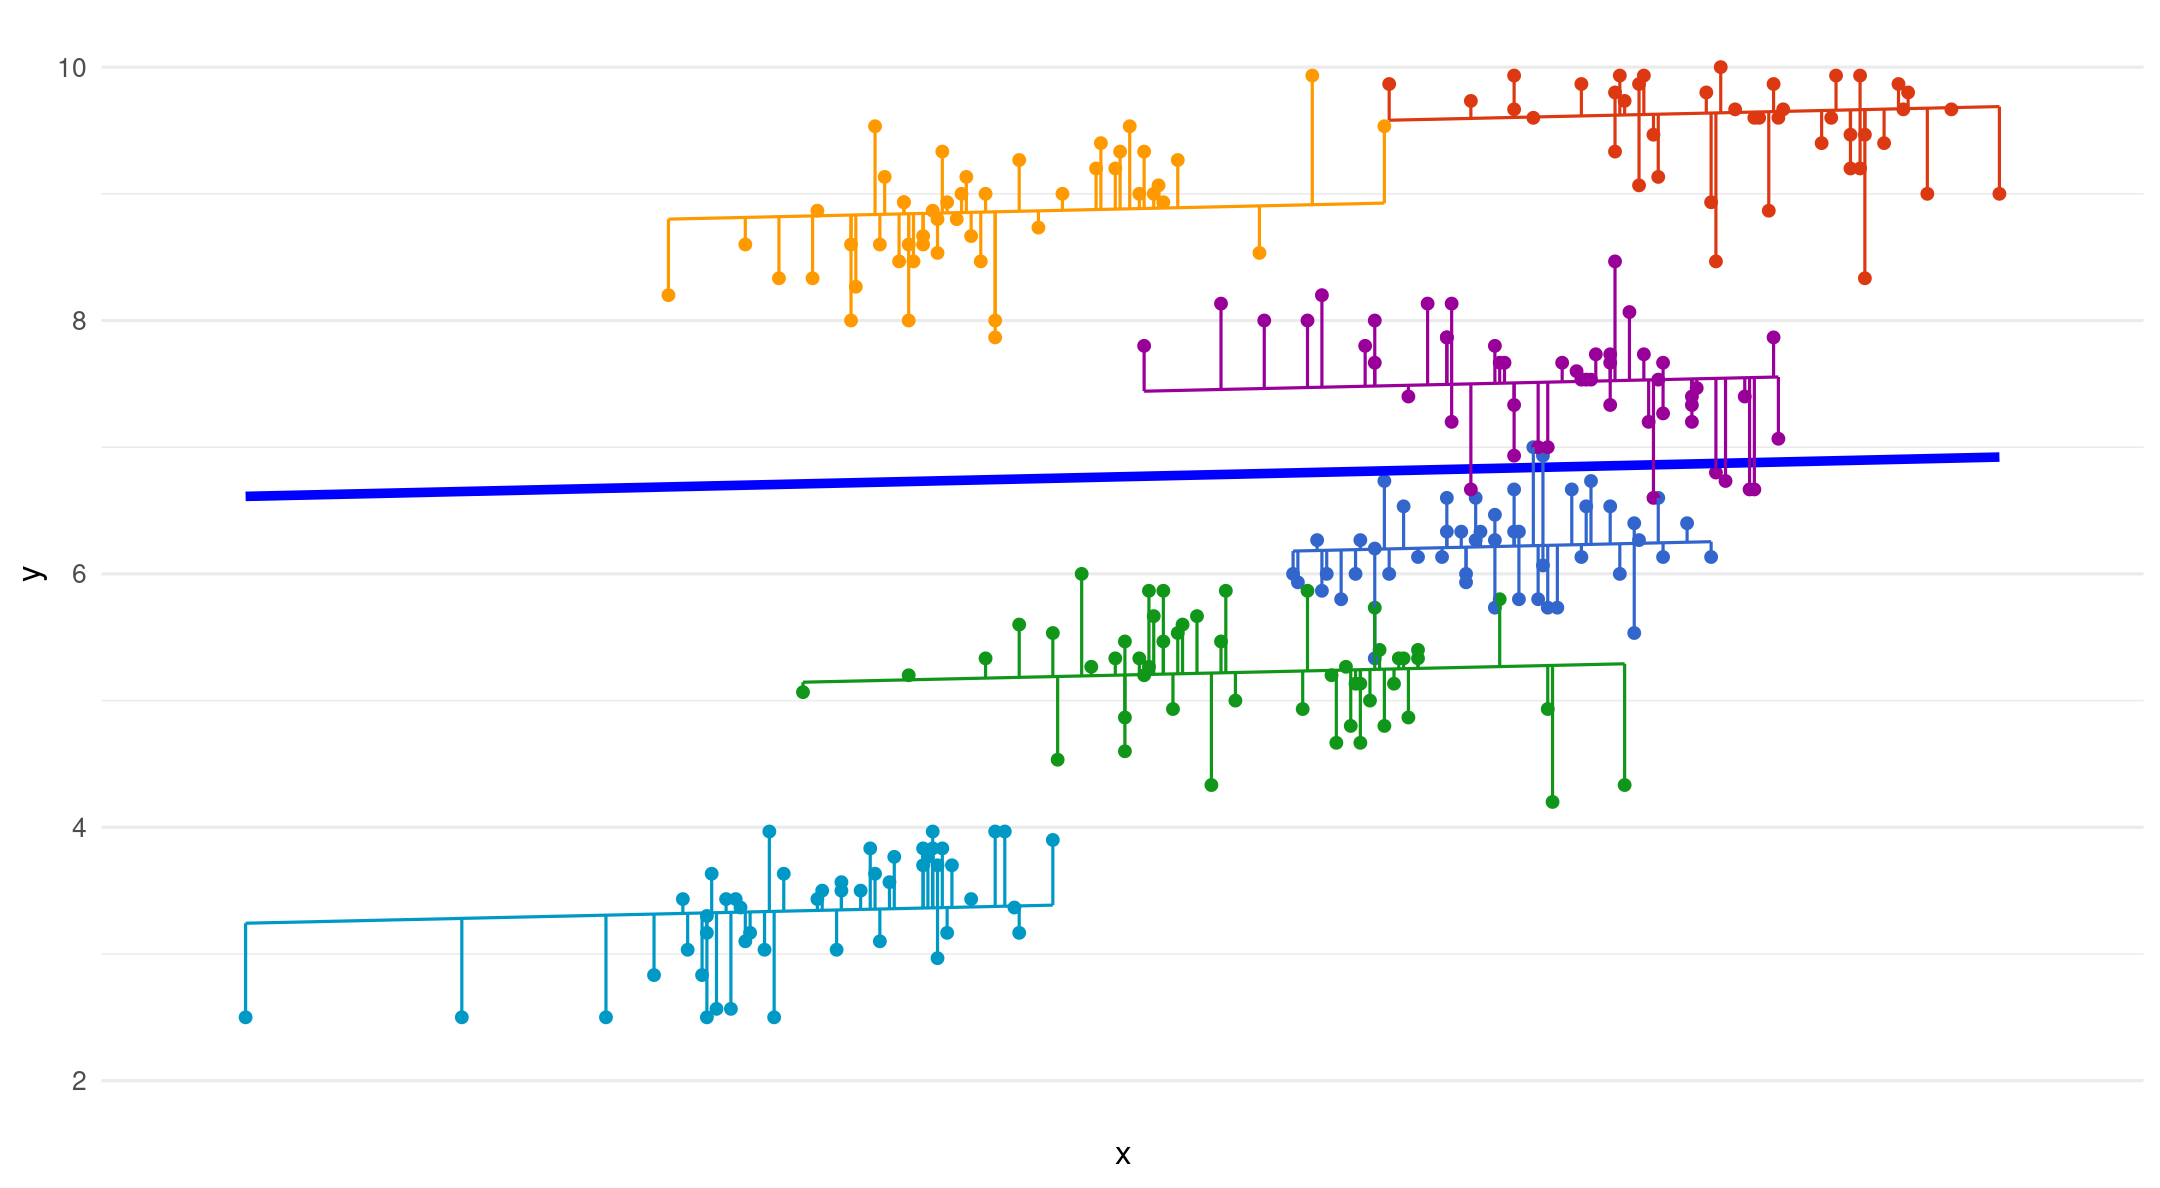
Random intercepts
\[ y_{ij} = ({b_{0j_{\text{(intercept)}}} + U_{0j_{\text{(random intercept)}}}}) + b_{1_{\text{(slope)}}} x_{ij} + \color{red}{ e_{ij_{\text{(error)}}}} \]
Within-group variation
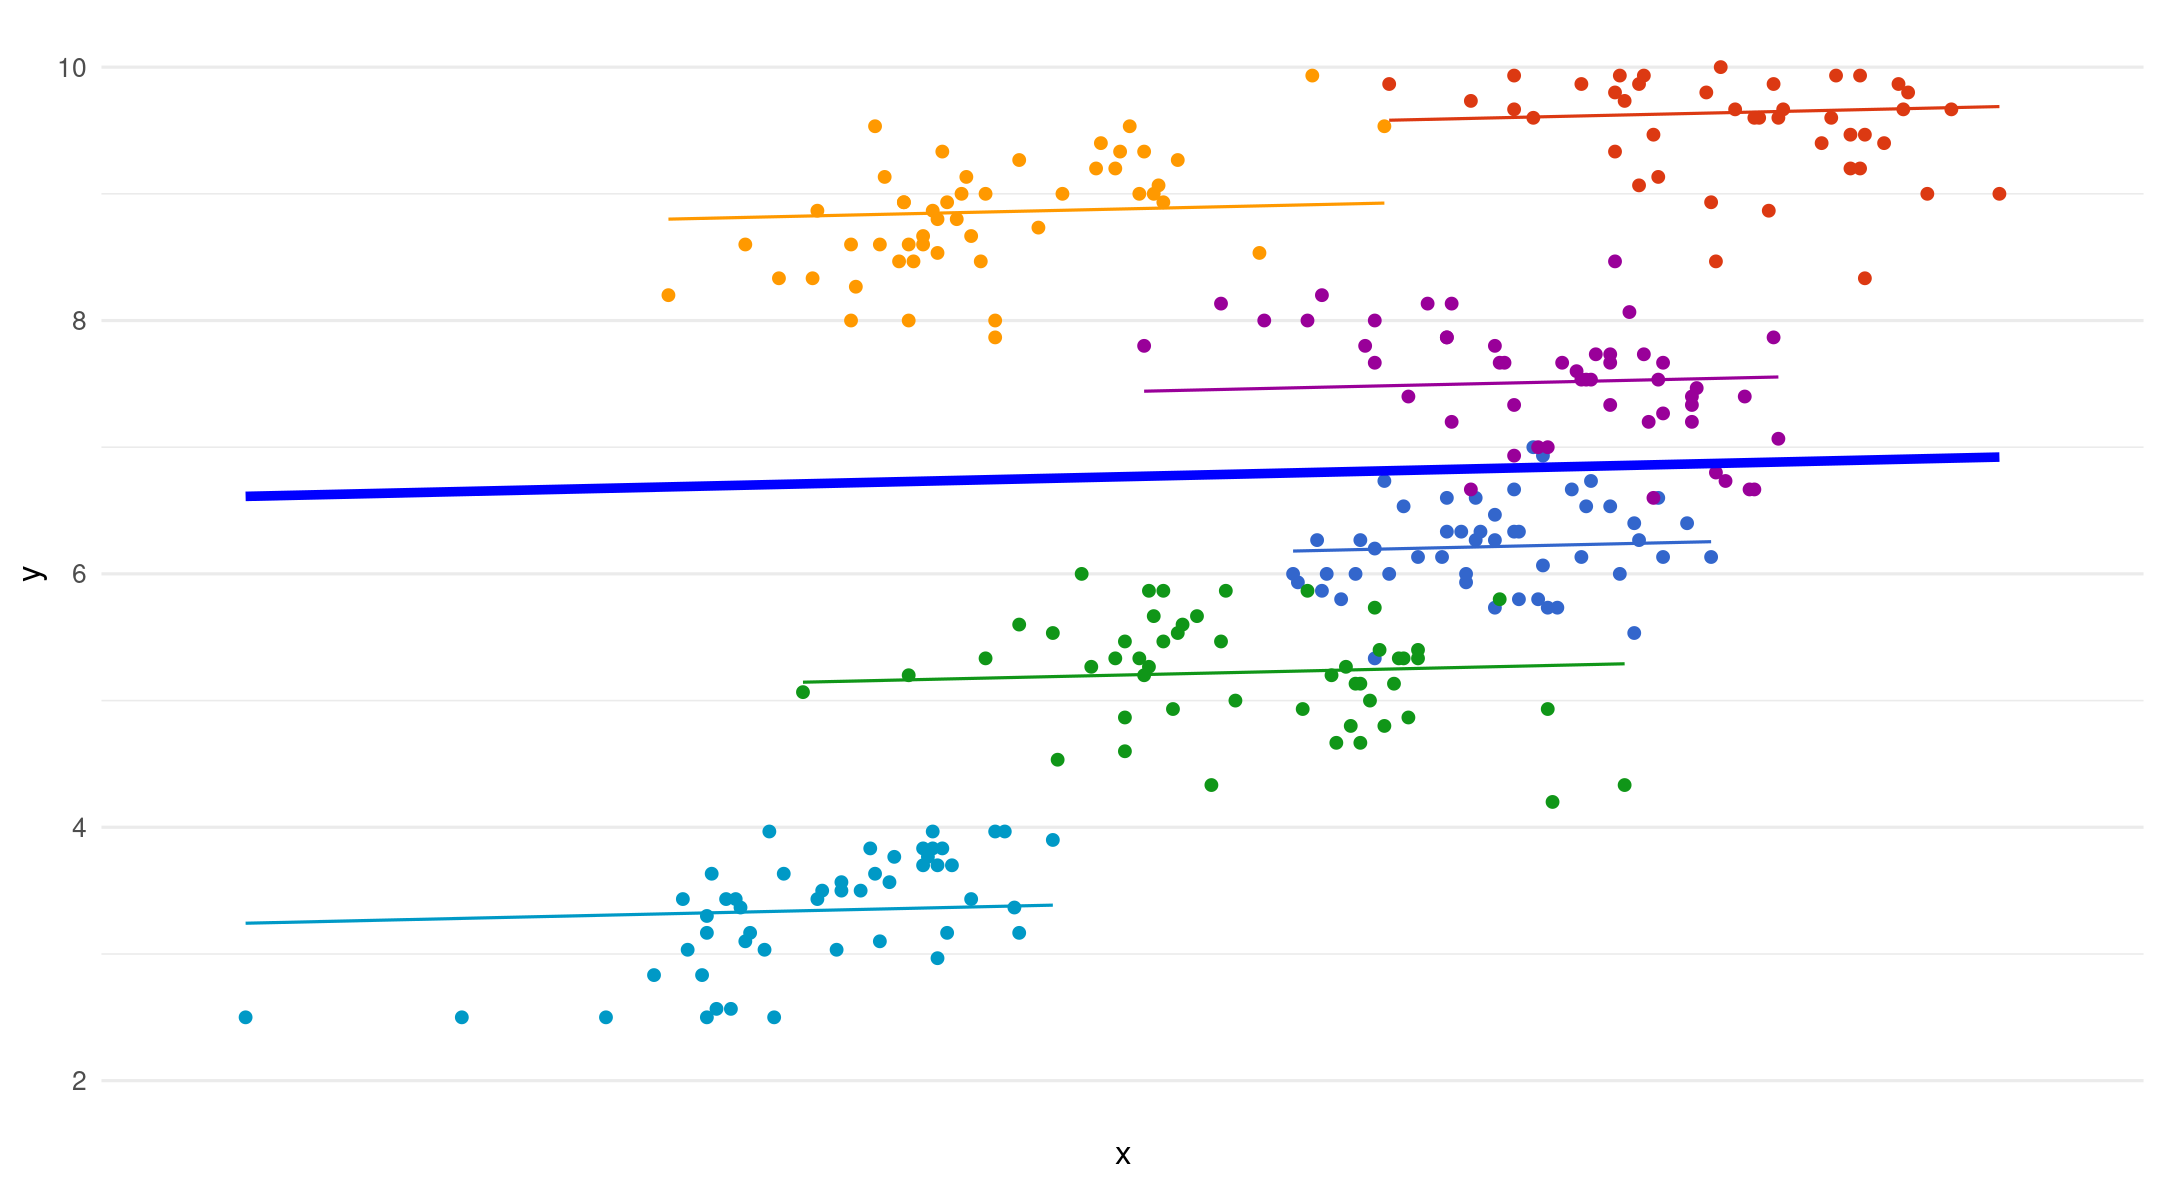
Random intercepts - fixed slope
- Varying starting point (intercept), same slope for each group
Random Intercepts - Random slopes
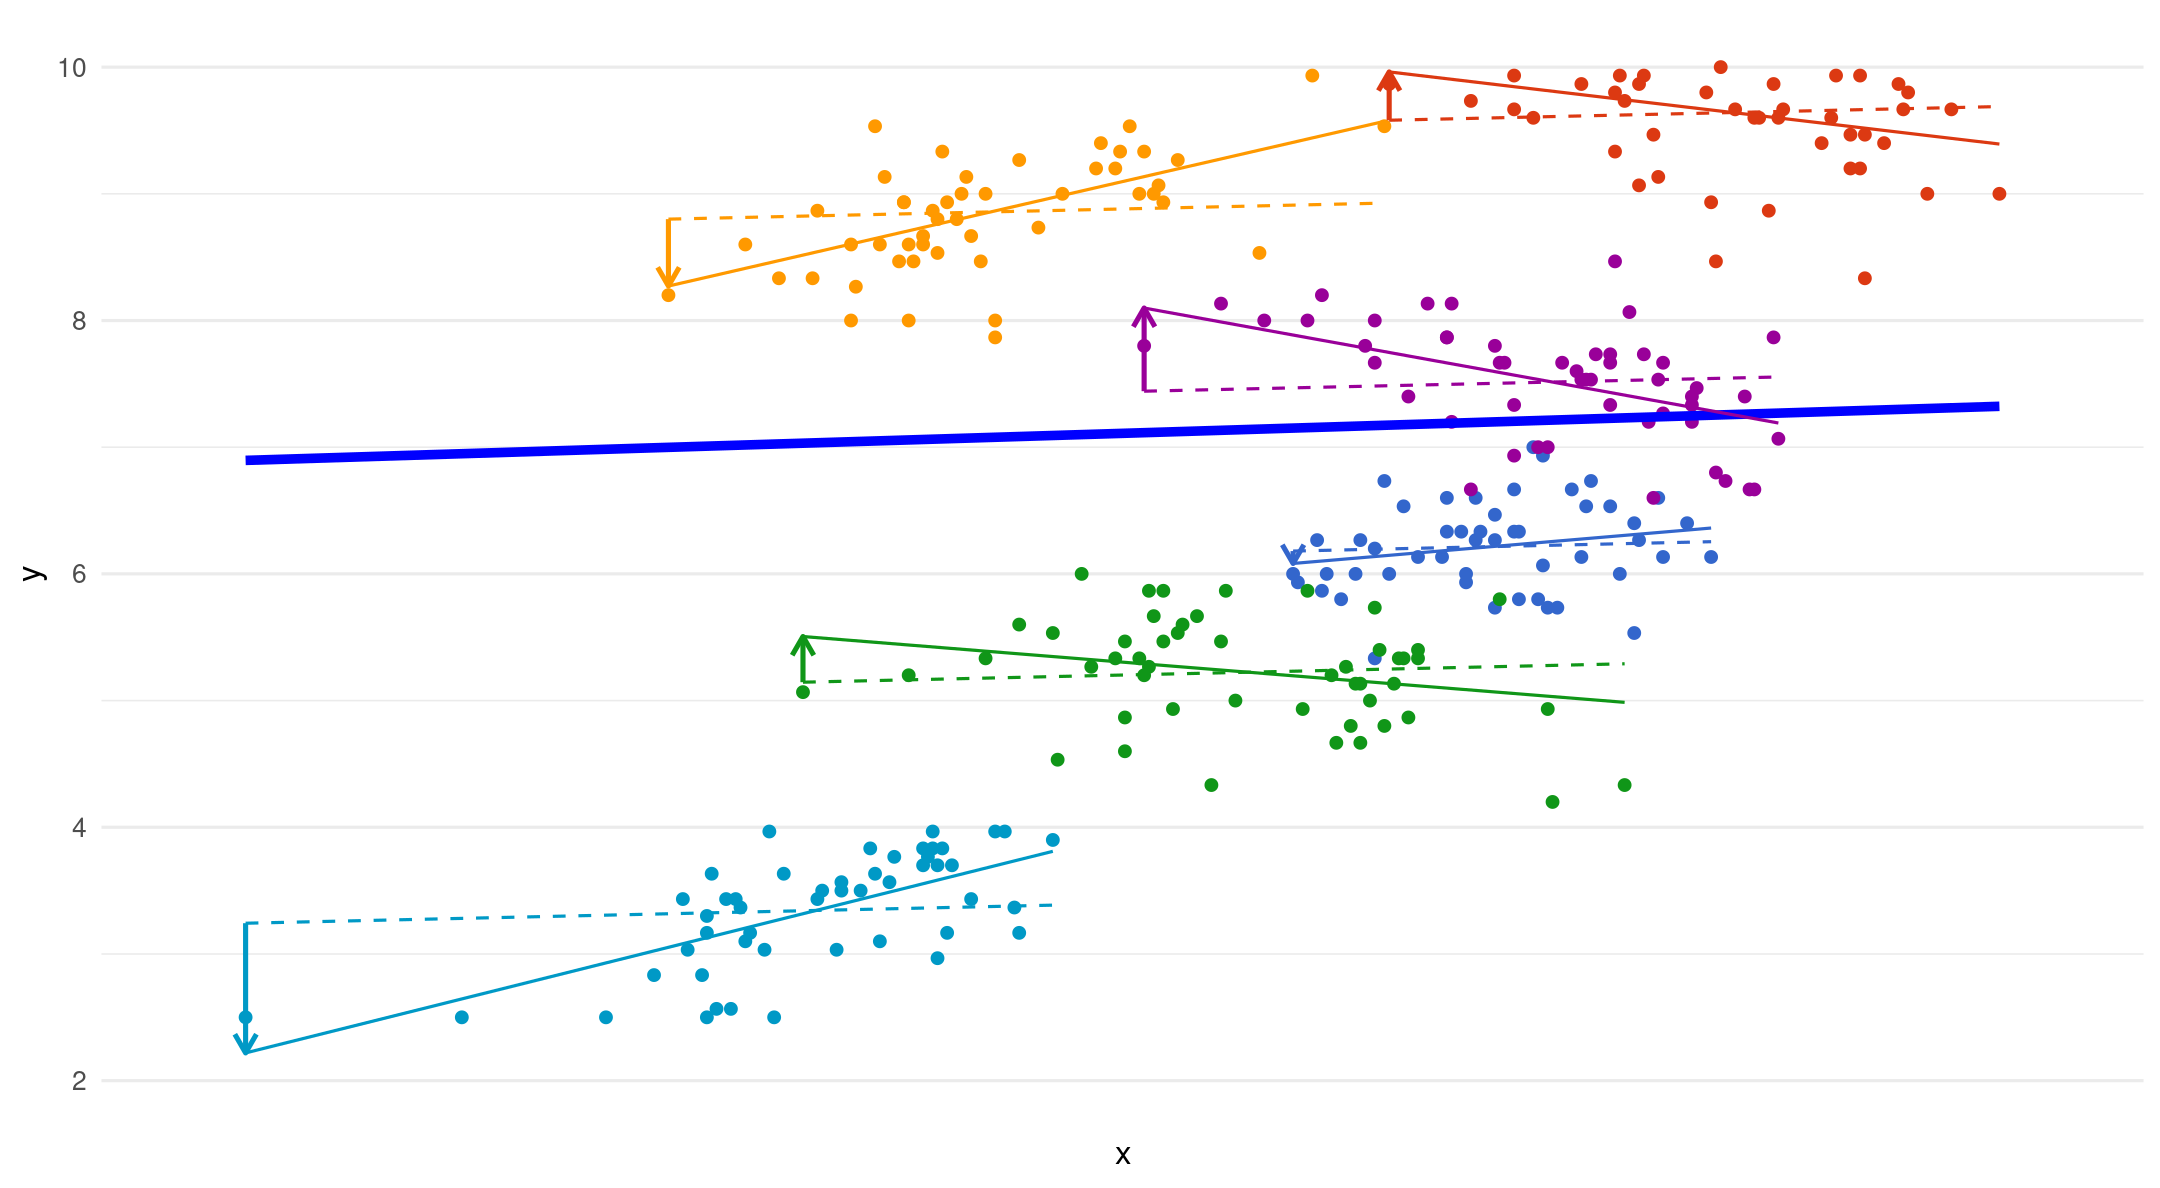
- Varying starting point (intercept), varying slope for each group
\[ y_{ij} = (\color{blue}{b_{0j_{\text{(intercept)}}}} + \color{red}{U_{0j_{\text{(random intercept)}}}}) + (\color{blue}{b_{1_{\text{(slope)}}} x_{ij}} + \color{red}{U_{1j_{\text{(random slope)}}}}) + \color{red}{e_{ij_{\text{(error)}}}} \]
Important
- Only put a random slope if it changes within cluster/group
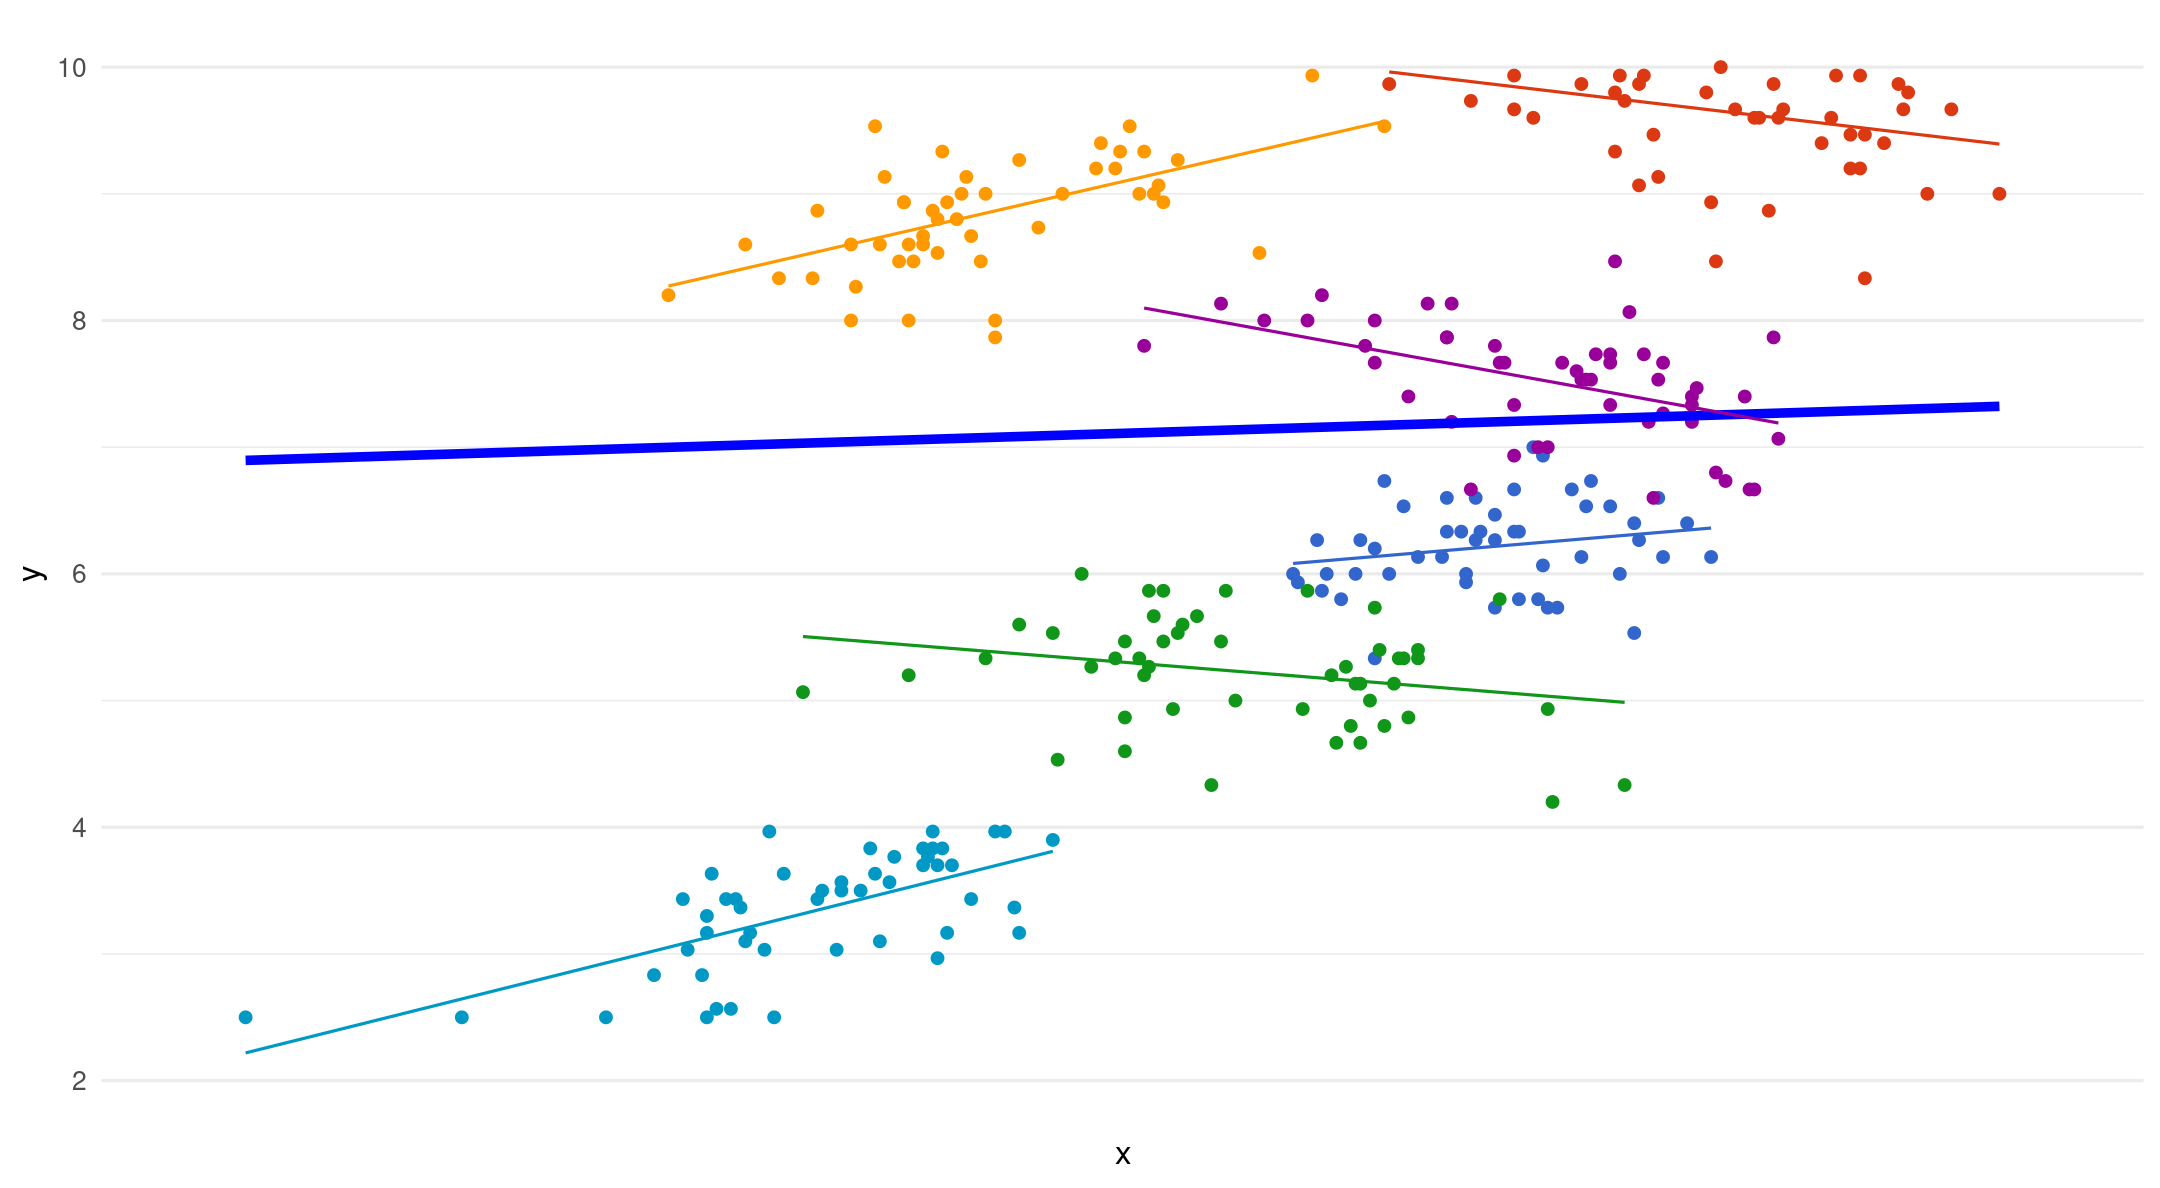
Random slopes
- The dotted lines are fixed slopes. The arrows show the added error term for each random slope
\[ U_{1j} = b_{1j} - b_1 \]
MLM Equations
| Level | Equation |
|---|---|
| Level 1 | \(y_{ij} = b_{0j} + b_{1j}X_{ij} + e_{ij}\) |
| Level 2 | \(b_{0j}=γ00+U_{0j}\) \(b_{1j} = \gamma{10} + U_{1j}\) |
| Combined | \(y_{ij} = \gamma_{0} + \gamma_{1}X_{ij} + e_{ij} + U_{b0j} + U_{b1j}X_{ij}\) |
- You will see both equations used in the literature
All together
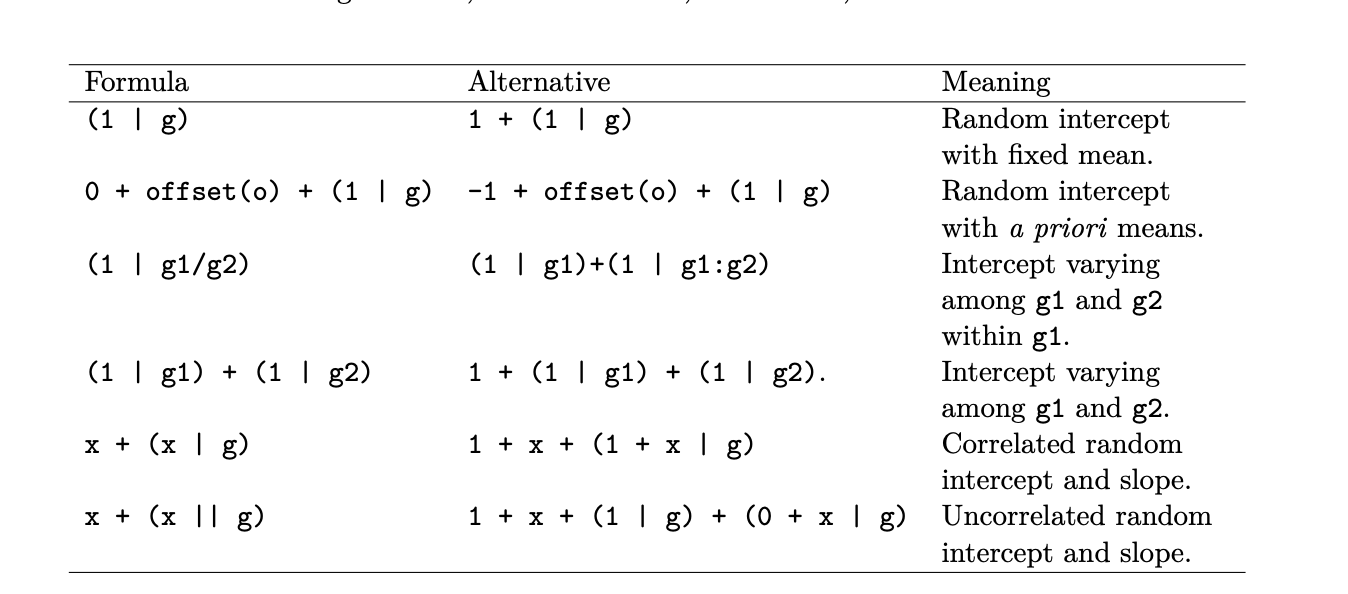
Syntax cheat sheet
How do your groups differ?
Different averages
Random intercept
- Each group gets its own intercept
Different relationships between x and y
Random Slope
- Each group gets its own slope
Implications
Multiple sources of variance?
- Just add more residuals!
Each source of variance gets its own residual term
Residuals capture variance
Residuals are added rendering them conditionally independent
- Otherwise, MLM is the same as GLM
How are MLMs similar to LM?
The fixed effects (usually) hold your hypothesis tests
- Fixed effects output: Looks like GLM output
Can (essentially) be interpreted like GLM output
For most people, this is all that matters
How are LM and MLM different?
MLM has random effects output
Variance explained by the random effect
This may be interesting, in and of itself
Fixed effects of random terms are the average estimates across groups
Next class
PSY 504: Advaced Statistics


