Missing Data in R
Princeton University
2024-02-11
Today
MCAR, MAR, NMAR
Screening data for missingness
Diagnosing missing data mechanisms in R
Missing data methods in R
- Listwise deletion
- Casewise deletion
- Nonconditional and conditional imputation
- Multiple imputation
- Maximum likelihood
Reporting

Packages
Install the mice package
Load these packages:
Here is the link to the .qmd document to follow along: https://github.com/jgeller112/PSY504-Advanced-Stats-S24/blob/main/slides/03-Missing_Data/03-Missing_Data.qmd.
Missing data mechanisms
Most of modern missing data theory comes from the work of statistician Donald B. Rubin
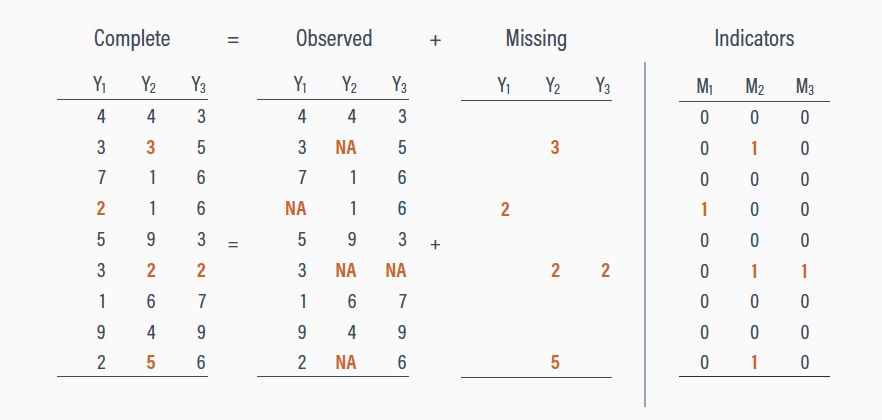
Rubin proposed we can divide an entire data set \(Y\) into two components:
\(Y_\text{obs}\) the observed values in the data set
\(Y_\text{mis}\) the missing values in the data set
\[Y = Y_\text{obs} + Y_\text{mis}\]
Missing data mechanisms
Missing data mechanisms (processes) describe different ways in which the data relate to nonresponse
Missingness may be completely random or systematically related to different parts of the data
Mechanisms function as statistical assumptions
Missing completely at random (MCAR)
The probability of missingness is unrelated to the data
MCAR is purely random missingness
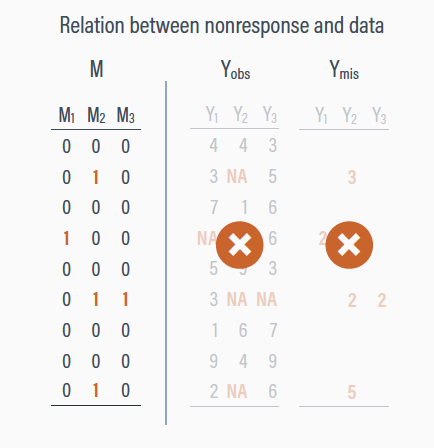
Conditionally missing at random (CMAR)
Systematic missingness related to the observed scores
The probability of missing values is unrelated to the unseen (latent) data
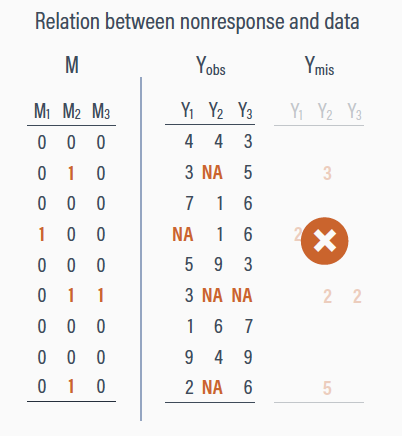
Not missing at random (NMAR)
Systematic missingness
The probability of missing values is related to the unseen (latent) data
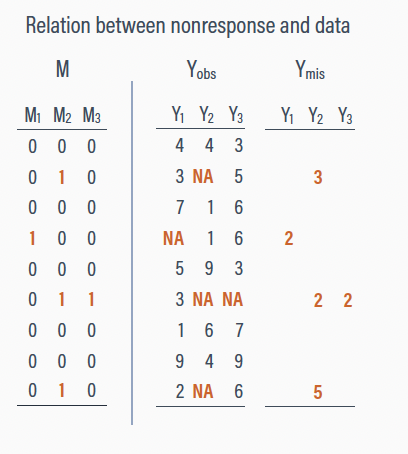
Data
Chronic pain example
Enders (2023)
Study (N = 275) investigating psychological correlates of chronic pain
- Depression (
depress) - Perceived control (
control)
- Depression (
Perceived control over pain is complete, depression scores are missing
Note
I manipulated the dataset so missingness is related to control over pain (i.e., low control is related to missingness on depression scores)
Chronic pain example
dat <- read.table("https://raw.githubusercontent.com/jgeller112/PSY504-Advanced-Stats-S24/main/slides/03-Missing_Data/APA%20Missing%20Data%20Training/Analysis%20Examples/pain.dat", na.strings = "999")

names(dat) <- c("id", "txgrp", "male", "age", "edugroup", "workhrs", "exercise", "paingrps",
                "pain", "anxiety", "stress", "control", "depress", "interfere", "disability",
                paste0("dep", seq(1:7)), paste0("int", seq(1:6)), paste0("dis", seq(1:6)))

dat <- dat  %>%
  select("id", "age", "control",  "depress", "stress") %>%
  mutate(depress=ifelse(depress==999, NA, depress)) %>%
    mutate(r_mar_low = ifelse(control < 15.51, 1, 0)) %>%
  mutate(depress = ifelse(r_mar_low == 1, NA, depress)) %>%
select(-r_mar_low)| id | age | control | depress | stress |
|---|---|---|---|---|
| 1 | 68 | 13 | NA | 5 |
| 2 | 38 | 19 | 28 | 7 |
| 3 | 31 | 20 | 8 | 4 |
| 4 | 31 | 17 | 28 | 7 |
| 5 | 58 | 22 | 12 | 3 |
| 6 | 63 | 26 | 13 | 5 |
| 7 | 38 | 16 | 23 | 5 |
| 8 | 54 | 30 | 12 | 1 |
| 9 | 66 | 20 | 9 | 3 |
| 10 | 31 | 27 | NA | 2 |
| 11 | 37 | 25 | 21 | 7 |
| 12 | 48 | 14 | NA | 4 |
| 13 | 33 | 17 | 20 | 4 |
| 14 | 47 | 13 | NA | 5 |
| 15 | 30 | 15 | NA | 1 |
| 16 | 48 | 29 | 8 | 3 |
| 17 | 58 | 27 | 13 | 1 |
| 18 | 51 | 26 | 9 | 4 |
| 19 | 47 | 21 | 15 | 2 |
| 20 | 41 | 17 | 18 | 5 |
| 21 | 31 | 18 | 26 | 7 |
| 22 | 52 | 23 | 18 | 3 |
| 23 | 51 | 22 | 15 | 4 |
| 24 | 53 | 14 | NA | 2 |
| 25 | 65 | 18 | 17 | 7 |
| 26 | 47 | 18 | NA | 4 |
| 27 | 46 | 20 | 15 | 4 |
| 28 | 34 | 6 | NA | 4 |
| 29 | 61 | 23 | 8 | 1 |
| 30 | 47 | 26 | 18 | 5 |
| 31 | 65 | 19 | NA | 4 |
| 32 | 37 | 14 | NA | 5 |
| 33 | 48 | 14 | NA | 6 |
| 34 | 41 | 22 | 24 | 6 |
| 35 | 41 | 14 | NA | 3 |
| 36 | 41 | 18 | 21 | 6 |
| 37 | 42 | 9 | NA | 1 |
| 38 | 33 | 24 | NA | 4 |
| 39 | 72 | 25 | 9 | 4 |
| 40 | 54 | 22 | 10 | 3 |
| 41 | 54 | 26 | 14 | 2 |
| 42 | 49 | 23 | 8 | 1 |
| 43 | 43 | 20 | NA | 1 |
| 44 | 40 | 20 | 16 | 2 |
| 45 | 46 | 26 | 14 | 2 |
| 46 | 35 | 25 | 10 | 6 |
| 47 | 44 | 16 | 17 | 6 |
| 48 | 41 | 30 | 7 | 1 |
| 49 | 30 | 20 | 28 | 7 |
| 50 | 31 | 25 | 19 | 4 |
| 51 | 43 | 13 | NA | 6 |
| 52 | 31 | 15 | NA | 1 |
| 53 | 45 | 19 | 13 | 3 |
| 54 | 55 | 24 | 11 | 7 |
| 55 | 50 | 13 | NA | 7 |
| 56 | 58 | 26 | 14 | 1 |
| 57 | 36 | 23 | 9 | 4 |
| 58 | 45 | 28 | NA | 4 |
| 59 | 50 | 24 | NA | 1 |
| 60 | 32 | 30 | 11 | 7 |
| 61 | 51 | 21 | 8 | 2 |
| 62 | 32 | 16 | 16 | 7 |
| 63 | 54 | 23 | 12 | 4 |
| 64 | 36 | 13 | NA | 1 |
| 65 | 41 | 17 | 24 | 4 |
| 66 | 52 | 27 | 7 | 2 |
| 67 | 61 | 27 | 13 | 7 |
| 68 | 38 | 17 | 16 | 3 |
| 69 | 38 | 18 | 25 | 4 |
| 70 | 46 | 29 | NA | 2 |
| 71 | 58 | 19 | 7 | 1 |
| 72 | 37 | 22 | NA | 4 |
| 73 | 46 | 16 | 12 | 5 |
| 74 | 72 | 24 | 24 | 5 |
| 75 | 32 | 15 | NA | 6 |
| 76 | 49 | 24 | 16 | 2 |
| 77 | 46 | 8 | NA | 6 |
| 78 | 38 | 26 | 8 | 4 |
| 79 | 40 | 18 | 27 | 6 |
| 80 | 40 | 20 | 11 | 4 |
| 81 | 53 | 27 | NA | 3 |
| 82 | 55 | 12 | NA | 4 |
| 83 | 23 | 15 | NA | 3 |
| 84 | 47 | 22 | 8 | 1 |
| 85 | 49 | 22 | 28 | 6 |
| 86 | 62 | 24 | 27 | 6 |
| 87 | 50 | 18 | 15 | 7 |
| 88 | 52 | 21 | NA | 4 |
| 89 | 26 | 18 | 24 | 7 |
| 90 | 46 | 18 | 25 | 4 |
| 91 | 45 | 23 | 22 | 6 |
| 92 | 70 | 28 | 9 | 6 |
| 93 | 26 | 22 | 11 | 5 |
| 94 | 26 | 21 | 17 | 4 |
| 95 | 53 | 16 | 19 | 6 |
| 96 | 43 | 27 | 15 | 4 |
| 97 | 22 | 22 | 27 | 4 |
| 98 | 35 | 19 | 14 | 3 |
| 99 | 41 | 17 | 17 | 4 |
| 100 | 48 | 16 | 26 | 7 |
| 101 | 62 | 25 | 14 | 2 |
| 102 | 53 | 22 | 13 | 4 |
| 103 | 46 | 13 | NA | 4 |
| 104 | 59 | 13 | NA | 1 |
| 105 | 28 | 28 | 8 | 5 |
| 106 | 31 | 14 | NA | 4 |
| 107 | 45 | 29 | 15 | 4 |
| 108 | 38 | 21 | NA | 7 |
| 109 | 48 | 25 | 13 | 5 |
| 110 | 32 | 9 | NA | 5 |
| 111 | 36 | 27 | 13 | 5 |
| 112 | 46 | 14 | NA | 5 |
| 113 | 65 | 24 | 15 | 5 |
| 114 | 29 | 21 | 8 | 3 |
| 115 | 34 | 17 | NA | 7 |
| 116 | 42 | 21 | 20 | 7 |
| 117 | 39 | 17 | 14 | 4 |
| 118 | 53 | 22 | 13 | 4 |
| 119 | 43 | 23 | 13 | 5 |
| 120 | 43 | 23 | 8 | 3 |
| 121 | 36 | 20 | 20 | 6 |
| 122 | 40 | 19 | 20 | 4 |
| 123 | 67 | 29 | 20 | 6 |
| 124 | 45 | 29 | 15 | 5 |
| 125 | 28 | 19 | 13 | 5 |
| 126 | 59 | 13 | NA | 6 |
| 127 | 33 | 22 | 16 | 3 |
| 128 | 28 | 25 | 26 | 5 |
| 129 | 62 | 22 | 8 | 4 |
| 130 | 30 | 23 | 9 | 3 |
| 131 | 37 | 21 | 7 | 1 |
| 132 | 41 | 22 | 7 | 2 |
| 133 | 47 | 20 | 9 | 1 |
| 134 | 56 | 23 | 14 | 4 |
| 135 | 50 | 16 | 27 | 7 |
| 136 | 57 | 20 | 16 | 3 |
| 137 | 51 | 29 | 8 | 1 |
| 138 | 28 | 20 | 27 | 6 |
| 139 | 45 | 17 | 8 | 3 |
| 140 | 34 | 22 | 15 | 5 |
| 141 | 44 | 29 | 8 | 1 |
| 142 | 37 | 19 | 15 | 3 |
| 143 | 43 | 17 | NA | 7 |
| 144 | 38 | 21 | 14 | 4 |
| 145 | 56 | 23 | 10 | 1 |
| 146 | 34 | 11 | NA | 4 |
| 147 | 67 | 20 | NA | 1 |
| 148 | 67 | 28 | 15 | 6 |
| 149 | 46 | 30 | 8 | 5 |
| 150 | 48 | 17 | 27 | 5 |
| 151 | 46 | 12 | NA | 7 |
| 152 | 43 | 25 | 7 | 1 |
| 153 | 41 | 21 | 22 | 4 |
| 154 | 41 | 21 | 8 | 2 |
| 155 | 51 | 29 | 7 | 2 |
| 156 | 49 | 16 | 17 | 5 |
| 157 | 26 | 16 | 12 | 4 |
| 158 | 38 | 24 | 9 | 4 |
| 159 | 48 | 11 | NA | 5 |
| 160 | 19 | 12 | NA | 6 |
| 161 | 64 | 25 | 8 | 2 |
| 162 | 65 | 12 | NA | 3 |
| 163 | 46 | 24 | 12 | 4 |
| 164 | 44 | 17 | 16 | 5 |
| 165 | 53 | 9 | NA | 7 |
| 166 | 59 | 16 | 12 | 3 |
| 167 | 60 | 20 | 21 | 6 |
| 168 | 28 | 13 | NA | 4 |
| 169 | 45 | 23 | NA | 2 |
| 170 | 55 | 25 | 9 | 1 |
| 171 | 49 | 30 | 27 | 2 |
| 172 | 53 | 20 | 13 | 2 |
| 173 | 37 | 30 | 8 | 1 |
| 174 | 51 | 20 | 19 | 4 |
| 175 | 55 | 27 | NA | 1 |
| 176 | 63 | 21 | 9 | 5 |
| 177 | 48 | 30 | 7 | 4 |
| 178 | 58 | 28 | 9 | 1 |
| 179 | 57 | 17 | 13 | 6 |
| 180 | 49 | 25 | 12 | 3 |
| 181 | 32 | 15 | NA | 6 |
| 182 | 51 | 17 | 14 | 4 |
| 183 | 78 | 28 | NA | 4 |
| 184 | 56 | 22 | 10 | 6 |
| 185 | 46 | 18 | 12 | 3 |
| 186 | 40 | 20 | 22 | 4 |
| 187 | 55 | 26 | 10 | 2 |
| 188 | 30 | 16 | 21 | 3 |
| 189 | 54 | 24 | 8 | 3 |
| 190 | 55 | 27 | 8 | 1 |
| 191 | 42 | 29 | 10 | 3 |
| 192 | 57 | 14 | NA | 5 |
| 193 | 42 | 22 | 19 | 7 |
| 194 | 37 | 14 | NA | 4 |
| 195 | 44 | 9 | NA | 1 |
| 196 | 34 | 19 | 24 | 3 |
| 197 | 31 | 20 | NA | 6 |
| 198 | 58 | 26 | 10 | 4 |
| 199 | 53 | 30 | 7 | 1 |
| 200 | 33 | 22 | NA | 5 |
| 201 | 19 | 7 | NA | 3 |
| 202 | 61 | 13 | NA | 4 |
| 203 | 42 | 17 | NA | 3 |
| 204 | 40 | 18 | 7 | 1 |
| 205 | 42 | 18 | 22 | 5 |
| 206 | 36 | 21 | 10 | 2 |
| 207 | 58 | 19 | 8 | 1 |
| 208 | 40 | 21 | 12 | 4 |
| 209 | 68 | 25 | 14 | 5 |
| 210 | 34 | 23 | NA | 4 |
| 211 | 49 | 19 | NA | 3 |
| 212 | 42 | 21 | NA | 6 |
| 213 | 41 | 27 | 20 | 4 |
| 214 | 32 | 27 | 12 | 3 |
| 215 | 50 | 16 | 19 | 5 |
| 216 | 31 | 17 | 18 | 5 |
| 217 | 34 | 14 | NA | 6 |
| 218 | 47 | 14 | NA | 5 |
| 219 | 41 | 19 | NA | 2 |
| 220 | 33 | 22 | 8 | 3 |
| 221 | 46 | 13 | NA | 7 |
| 222 | 25 | 14 | NA | 5 |
| 223 | 30 | 16 | 7 | 3 |
| 224 | 41 | 22 | 13 | 3 |
| 225 | 48 | 8 | NA | 7 |
| 226 | 42 | 22 | 26 | 4 |
| 227 | 46 | 20 | NA | 6 |
| 228 | 51 | 20 | 15 | 4 |
| 229 | 47 | 20 | 8 | 5 |
| 230 | 37 | 22 | NA | 1 |
| 231 | 30 | 21 | 28 | 3 |
| 232 | 38 | 29 | NA | 4 |
| 233 | 49 | 30 | 15 | 1 |
| 234 | 58 | 25 | 7 | 3 |
| 235 | 47 | 15 | NA | 5 |
| 236 | 55 | 26 | NA | 4 |
| 237 | 54 | 22 | 19 | 6 |
| 238 | 58 | 17 | 9 | 1 |
| 239 | 49 | 27 | 14 | 1 |
| 240 | 57 | 21 | 13 | 5 |
| 241 | 46 | 27 | 7 | 5 |
| 242 | 40 | 25 | 9 | 3 |
| 243 | 29 | 28 | 7 | 3 |
| 244 | 53 | 23 | 12 | 4 |
| 245 | 41 | 16 | 13 | 5 |
| 246 | 31 | 20 | 14 | 3 |
| 247 | 48 | 21 | 11 | 4 |
| 248 | 43 | 21 | 10 | 1 |
| 249 | 66 | 17 | 21 | 2 |
| 250 | 40 | 20 | 9 | 4 |
| 251 | 38 | 28 | NA | 1 |
| 252 | 41 | 27 | 24 | 4 |
| 253 | 63 | 19 | 13 | 4 |
| 254 | 42 | 27 | 8 | 4 |
| 255 | 58 | 20 | 21 | 7 |
| 256 | 52 | 28 | 20 | 6 |
| 257 | 51 | 27 | 9 | 6 |
| 258 | 58 | 28 | 9 | 1 |
| 259 | 69 | 28 | 15 | 4 |
| 260 | 41 | 20 | 20 | 4 |
| 261 | 37 | 25 | 11 | 6 |
| 262 | 61 | 19 | NA | 5 |
| 263 | 47 | 15 | NA | 3 |
| 264 | 45 | 23 | NA | 3 |
| 265 | 45 | 21 | 7 | 3 |
| 266 | 47 | 18 | 8 | 3 |
| 267 | 57 | 20 | 14 | 3 |
| 268 | 60 | 21 | 10 | 4 |
| 269 | 50 | 20 | 18 | 6 |
| 270 | 36 | 25 | 10 | 4 |
| 271 | 20 | 14 | NA | 4 |
| 272 | 74 | 28 | 7 | 1 |
| 273 | 50 | 22 | 10 | 1 |
| 274 | 61 | 29 | 8 | 2 |
| 275 | 53 | 24 | 13 | 4 |
Exploratory data analysis (EDA)
- Look at your data
- Need to identify missing data!
Explore data using descriptive statistics and figures
- What variables have missing data? How much is missing in total? By variable?
EDA

EDA
| skim_type | skim_variable | n_missing | complete_rate | numeric.mean | numeric.sd | numeric.p0 | numeric.p25 | numeric.p50 | numeric.p75 | numeric.p100 | numeric.hist |
|---|---|---|---|---|---|---|---|---|---|---|---|
| numeric | id | 0 | 1.00 | 138.000000 | 79.529869 | 1 | 69.5 | 138 | 206.5 | 275 | ▇▇▇▇▇ |
| numeric | age | 0 | 1.00 | 45.643636 | 11.271221 | 19 | 38.0 | 46 | 53.0 | 78 | ▂▇▇▃▁ |
| numeric | control | 0 | 1.00 | 20.763636 | 5.252610 | 6 | 17.0 | 21 | 25.0 | 30 | ▁▃▇▇▅ |
| numeric | depress | 77 | 0.72 | 14.303030 | 6.058018 | 7 | 9.0 | 13 | 18.0 | 28 | ▇▆▂▂▂ |
| numeric | stress | 0 | 1.00 | 3.901818 | 1.802623 | 1 | 3.0 | 4 | 5.0 | 7 | ▇▅▇▅▆ |
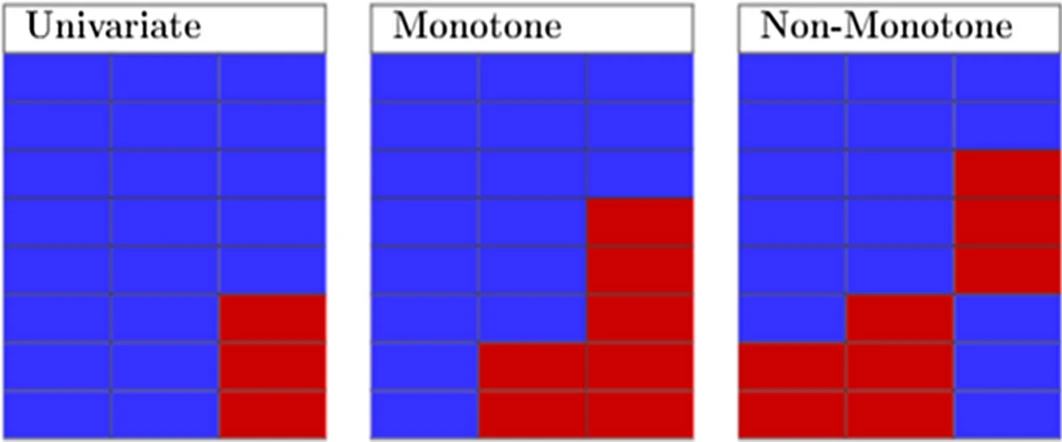
Missing patterns
Missing patterns
Univariate: one variable with missing data
Monotone: patterns in the data can be arranged
- Associated with a longitudinal studies where members drop out and never return
Non-monotone: missingness of one variable does not affect the missingness of any other variables
- Look for islands of missingness
Is it MCAR or MAR?

Is it MCAR or MAR?
Can make a case for MCAR
Little’s test
\(\chi^2\)
Sig = not MCAR
Not sig = MCAR
- Not used much anymore!
Is it MCAR or MAR?

Is it MCAR or MAR?
Our job is to find out if our data is MAR
Create a dummy coded variable for missing variable where 1 = score missing and 0 = score not missing on missing variable
If these variables are related to other variables in dataset
- MAR
Testing
- lm or t-test
| term | estimate | std.error | statistic | p.value |
|---|---|---|---|---|
| (Intercept) | 22.348485 | 0.3270999 | 68.323107 | 0 |
| depress_1 | -5.660173 | 0.6181608 | -9.156474 | 0 |
- It looks like missing on depression is related to control!
Methods for dealing with MCAR
Listwise deletion
| id | age | control | depress | stress |
|---|---|---|---|---|
| 1 | 68 | 13 | NA | 5 |
| 2 | 38 | 19 | 28 | 7 |
| 3 | 31 | 20 | 8 | 4 |
| 4 | 31 | 17 | 28 | 7 |
| 5 | 58 | 22 | 12 | 3 |
| 6 | 63 | 26 | 13 | 5 |
| 7 | 38 | 16 | 23 | 5 |
| 8 | 54 | 30 | 12 | 1 |
| 9 | 66 | 20 | 9 | 3 |
| 10 | 31 | 27 | NA | 2 |
| 11 | 37 | 25 | 21 | 7 |
| 12 | 48 | 14 | NA | 4 |
| 13 | 33 | 17 | 20 | 4 |
| 14 | 47 | 13 | NA | 5 |
| 15 | 30 | 15 | NA | 1 |
| 16 | 48 | 29 | 8 | 3 |
| 17 | 58 | 27 | 13 | 1 |
| 18 | 51 | 26 | 9 | 4 |
| 19 | 47 | 21 | 15 | 2 |
| 20 | 41 | 17 | 18 | 5 |
| 21 | 31 | 18 | 26 | 7 |
| 22 | 52 | 23 | 18 | 3 |
| 23 | 51 | 22 | 15 | 4 |
| 24 | 53 | 14 | NA | 2 |
| 25 | 65 | 18 | 17 | 7 |
| 26 | 47 | 18 | NA | 4 |
| 27 | 46 | 20 | 15 | 4 |
| 28 | 34 | 6 | NA | 4 |
| 29 | 61 | 23 | 8 | 1 |
| 30 | 47 | 26 | 18 | 5 |
| 31 | 65 | 19 | NA | 4 |
| 32 | 37 | 14 | NA | 5 |
| 33 | 48 | 14 | NA | 6 |
| 34 | 41 | 22 | 24 | 6 |
| 35 | 41 | 14 | NA | 3 |
| 36 | 41 | 18 | 21 | 6 |
| 37 | 42 | 9 | NA | 1 |
| 38 | 33 | 24 | NA | 4 |
| 39 | 72 | 25 | 9 | 4 |
| 40 | 54 | 22 | 10 | 3 |
| 41 | 54 | 26 | 14 | 2 |
| 42 | 49 | 23 | 8 | 1 |
| 43 | 43 | 20 | NA | 1 |
| 44 | 40 | 20 | 16 | 2 |
| 45 | 46 | 26 | 14 | 2 |
| 46 | 35 | 25 | 10 | 6 |
| 47 | 44 | 16 | 17 | 6 |
| 48 | 41 | 30 | 7 | 1 |
| 49 | 30 | 20 | 28 | 7 |
| 50 | 31 | 25 | 19 | 4 |
| 51 | 43 | 13 | NA | 6 |
| 52 | 31 | 15 | NA | 1 |
| 53 | 45 | 19 | 13 | 3 |
| 54 | 55 | 24 | 11 | 7 |
| 55 | 50 | 13 | NA | 7 |
| 56 | 58 | 26 | 14 | 1 |
| 57 | 36 | 23 | 9 | 4 |
| 58 | 45 | 28 | NA | 4 |
| 59 | 50 | 24 | NA | 1 |
| 60 | 32 | 30 | 11 | 7 |
| 61 | 51 | 21 | 8 | 2 |
| 62 | 32 | 16 | 16 | 7 |
| 63 | 54 | 23 | 12 | 4 |
| 64 | 36 | 13 | NA | 1 |
| 65 | 41 | 17 | 24 | 4 |
| 66 | 52 | 27 | 7 | 2 |
| 67 | 61 | 27 | 13 | 7 |
| 68 | 38 | 17 | 16 | 3 |
| 69 | 38 | 18 | 25 | 4 |
| 70 | 46 | 29 | NA | 2 |
| 71 | 58 | 19 | 7 | 1 |
| 72 | 37 | 22 | NA | 4 |
| 73 | 46 | 16 | 12 | 5 |
| 74 | 72 | 24 | 24 | 5 |
| 75 | 32 | 15 | NA | 6 |
| 76 | 49 | 24 | 16 | 2 |
| 77 | 46 | 8 | NA | 6 |
| 78 | 38 | 26 | 8 | 4 |
| 79 | 40 | 18 | 27 | 6 |
| 80 | 40 | 20 | 11 | 4 |
| 81 | 53 | 27 | NA | 3 |
| 82 | 55 | 12 | NA | 4 |
| 83 | 23 | 15 | NA | 3 |
| 84 | 47 | 22 | 8 | 1 |
| 85 | 49 | 22 | 28 | 6 |
| 86 | 62 | 24 | 27 | 6 |
| 87 | 50 | 18 | 15 | 7 |
| 88 | 52 | 21 | NA | 4 |
| 89 | 26 | 18 | 24 | 7 |
| 90 | 46 | 18 | 25 | 4 |
| 91 | 45 | 23 | 22 | 6 |
| 92 | 70 | 28 | 9 | 6 |
| 93 | 26 | 22 | 11 | 5 |
| 94 | 26 | 21 | 17 | 4 |
| 95 | 53 | 16 | 19 | 6 |
| 96 | 43 | 27 | 15 | 4 |
| 97 | 22 | 22 | 27 | 4 |
| 98 | 35 | 19 | 14 | 3 |
| 99 | 41 | 17 | 17 | 4 |
| 100 | 48 | 16 | 26 | 7 |
| 101 | 62 | 25 | 14 | 2 |
| 102 | 53 | 22 | 13 | 4 |
| 103 | 46 | 13 | NA | 4 |
| 104 | 59 | 13 | NA | 1 |
| 105 | 28 | 28 | 8 | 5 |
| 106 | 31 | 14 | NA | 4 |
| 107 | 45 | 29 | 15 | 4 |
| 108 | 38 | 21 | NA | 7 |
| 109 | 48 | 25 | 13 | 5 |
| 110 | 32 | 9 | NA | 5 |
| 111 | 36 | 27 | 13 | 5 |
| 112 | 46 | 14 | NA | 5 |
| 113 | 65 | 24 | 15 | 5 |
| 114 | 29 | 21 | 8 | 3 |
| 115 | 34 | 17 | NA | 7 |
| 116 | 42 | 21 | 20 | 7 |
| 117 | 39 | 17 | 14 | 4 |
| 118 | 53 | 22 | 13 | 4 |
| 119 | 43 | 23 | 13 | 5 |
| 120 | 43 | 23 | 8 | 3 |
| 121 | 36 | 20 | 20 | 6 |
| 122 | 40 | 19 | 20 | 4 |
| 123 | 67 | 29 | 20 | 6 |
| 124 | 45 | 29 | 15 | 5 |
| 125 | 28 | 19 | 13 | 5 |
| 126 | 59 | 13 | NA | 6 |
| 127 | 33 | 22 | 16 | 3 |
| 128 | 28 | 25 | 26 | 5 |
| 129 | 62 | 22 | 8 | 4 |
| 130 | 30 | 23 | 9 | 3 |
| 131 | 37 | 21 | 7 | 1 |
| 132 | 41 | 22 | 7 | 2 |
| 133 | 47 | 20 | 9 | 1 |
| 134 | 56 | 23 | 14 | 4 |
| 135 | 50 | 16 | 27 | 7 |
| 136 | 57 | 20 | 16 | 3 |
| 137 | 51 | 29 | 8 | 1 |
| 138 | 28 | 20 | 27 | 6 |
| 139 | 45 | 17 | 8 | 3 |
| 140 | 34 | 22 | 15 | 5 |
| 141 | 44 | 29 | 8 | 1 |
| 142 | 37 | 19 | 15 | 3 |
| 143 | 43 | 17 | NA | 7 |
| 144 | 38 | 21 | 14 | 4 |
| 145 | 56 | 23 | 10 | 1 |
| 146 | 34 | 11 | NA | 4 |
| 147 | 67 | 20 | NA | 1 |
| 148 | 67 | 28 | 15 | 6 |
| 149 | 46 | 30 | 8 | 5 |
| 150 | 48 | 17 | 27 | 5 |
| 151 | 46 | 12 | NA | 7 |
| 152 | 43 | 25 | 7 | 1 |
| 153 | 41 | 21 | 22 | 4 |
| 154 | 41 | 21 | 8 | 2 |
| 155 | 51 | 29 | 7 | 2 |
| 156 | 49 | 16 | 17 | 5 |
| 157 | 26 | 16 | 12 | 4 |
| 158 | 38 | 24 | 9 | 4 |
| 159 | 48 | 11 | NA | 5 |
| 160 | 19 | 12 | NA | 6 |
| 161 | 64 | 25 | 8 | 2 |
| 162 | 65 | 12 | NA | 3 |
| 163 | 46 | 24 | 12 | 4 |
| 164 | 44 | 17 | 16 | 5 |
| 165 | 53 | 9 | NA | 7 |
| 166 | 59 | 16 | 12 | 3 |
| 167 | 60 | 20 | 21 | 6 |
| 168 | 28 | 13 | NA | 4 |
| 169 | 45 | 23 | NA | 2 |
| 170 | 55 | 25 | 9 | 1 |
| 171 | 49 | 30 | 27 | 2 |
| 172 | 53 | 20 | 13 | 2 |
| 173 | 37 | 30 | 8 | 1 |
| 174 | 51 | 20 | 19 | 4 |
| 175 | 55 | 27 | NA | 1 |
| 176 | 63 | 21 | 9 | 5 |
| 177 | 48 | 30 | 7 | 4 |
| 178 | 58 | 28 | 9 | 1 |
| 179 | 57 | 17 | 13 | 6 |
| 180 | 49 | 25 | 12 | 3 |
| 181 | 32 | 15 | NA | 6 |
| 182 | 51 | 17 | 14 | 4 |
| 183 | 78 | 28 | NA | 4 |
| 184 | 56 | 22 | 10 | 6 |
| 185 | 46 | 18 | 12 | 3 |
| 186 | 40 | 20 | 22 | 4 |
| 187 | 55 | 26 | 10 | 2 |
| 188 | 30 | 16 | 21 | 3 |
| 189 | 54 | 24 | 8 | 3 |
| 190 | 55 | 27 | 8 | 1 |
| 191 | 42 | 29 | 10 | 3 |
| 192 | 57 | 14 | NA | 5 |
| 193 | 42 | 22 | 19 | 7 |
| 194 | 37 | 14 | NA | 4 |
| 195 | 44 | 9 | NA | 1 |
| 196 | 34 | 19 | 24 | 3 |
| 197 | 31 | 20 | NA | 6 |
| 198 | 58 | 26 | 10 | 4 |
| 199 | 53 | 30 | 7 | 1 |
| 200 | 33 | 22 | NA | 5 |
| 201 | 19 | 7 | NA | 3 |
| 202 | 61 | 13 | NA | 4 |
| 203 | 42 | 17 | NA | 3 |
| 204 | 40 | 18 | 7 | 1 |
| 205 | 42 | 18 | 22 | 5 |
| 206 | 36 | 21 | 10 | 2 |
| 207 | 58 | 19 | 8 | 1 |
| 208 | 40 | 21 | 12 | 4 |
| 209 | 68 | 25 | 14 | 5 |
| 210 | 34 | 23 | NA | 4 |
| 211 | 49 | 19 | NA | 3 |
| 212 | 42 | 21 | NA | 6 |
| 213 | 41 | 27 | 20 | 4 |
| 214 | 32 | 27 | 12 | 3 |
| 215 | 50 | 16 | 19 | 5 |
| 216 | 31 | 17 | 18 | 5 |
| 217 | 34 | 14 | NA | 6 |
| 218 | 47 | 14 | NA | 5 |
| 219 | 41 | 19 | NA | 2 |
| 220 | 33 | 22 | 8 | 3 |
| 221 | 46 | 13 | NA | 7 |
| 222 | 25 | 14 | NA | 5 |
| 223 | 30 | 16 | 7 | 3 |
| 224 | 41 | 22 | 13 | 3 |
| 225 | 48 | 8 | NA | 7 |
| 226 | 42 | 22 | 26 | 4 |
| 227 | 46 | 20 | NA | 6 |
| 228 | 51 | 20 | 15 | 4 |
| 229 | 47 | 20 | 8 | 5 |
| 230 | 37 | 22 | NA | 1 |
| 231 | 30 | 21 | 28 | 3 |
| 232 | 38 | 29 | NA | 4 |
| 233 | 49 | 30 | 15 | 1 |
| 234 | 58 | 25 | 7 | 3 |
| 235 | 47 | 15 | NA | 5 |
| 236 | 55 | 26 | NA | 4 |
| 237 | 54 | 22 | 19 | 6 |
| 238 | 58 | 17 | 9 | 1 |
| 239 | 49 | 27 | 14 | 1 |
| 240 | 57 | 21 | 13 | 5 |
| 241 | 46 | 27 | 7 | 5 |
| 242 | 40 | 25 | 9 | 3 |
| 243 | 29 | 28 | 7 | 3 |
| 244 | 53 | 23 | 12 | 4 |
| 245 | 41 | 16 | 13 | 5 |
| 246 | 31 | 20 | 14 | 3 |
| 247 | 48 | 21 | 11 | 4 |
| 248 | 43 | 21 | 10 | 1 |
| 249 | 66 | 17 | 21 | 2 |
| 250 | 40 | 20 | 9 | 4 |
| 251 | 38 | 28 | NA | 1 |
| 252 | 41 | 27 | 24 | 4 |
| 253 | 63 | 19 | 13 | 4 |
| 254 | 42 | 27 | 8 | 4 |
| 255 | 58 | 20 | 21 | 7 |
| 256 | 52 | 28 | 20 | 6 |
| 257 | 51 | 27 | 9 | 6 |
| 258 | 58 | 28 | 9 | 1 |
| 259 | 69 | 28 | 15 | 4 |
| 260 | 41 | 20 | 20 | 4 |
| 261 | 37 | 25 | 11 | 6 |
| 262 | 61 | 19 | NA | 5 |
| 263 | 47 | 15 | NA | 3 |
| 264 | 45 | 23 | NA | 3 |
| 265 | 45 | 21 | 7 | 3 |
| 266 | 47 | 18 | 8 | 3 |
| 267 | 57 | 20 | 14 | 3 |
| 268 | 60 | 21 | 10 | 4 |
| 269 | 50 | 20 | 18 | 6 |
| 270 | 36 | 25 | 10 | 4 |
| 271 | 20 | 14 | NA | 4 |
| 272 | 74 | 28 | 7 | 1 |
| 273 | 50 | 22 | 10 | 1 |
| 274 | 61 | 29 | 8 | 2 |
| 275 | 53 | 24 | 13 | 4 |
| id | age | control | depress | stress |
|---|---|---|---|---|
| 2 | 38 | 19 | 28 | 7 |
| 3 | 31 | 20 | 8 | 4 |
| 4 | 31 | 17 | 28 | 7 |
| 5 | 58 | 22 | 12 | 3 |
| 6 | 63 | 26 | 13 | 5 |
| 7 | 38 | 16 | 23 | 5 |
| 8 | 54 | 30 | 12 | 1 |
| 9 | 66 | 20 | 9 | 3 |
| 11 | 37 | 25 | 21 | 7 |
| 13 | 33 | 17 | 20 | 4 |
| 16 | 48 | 29 | 8 | 3 |
| 17 | 58 | 27 | 13 | 1 |
| 18 | 51 | 26 | 9 | 4 |
| 19 | 47 | 21 | 15 | 2 |
| 20 | 41 | 17 | 18 | 5 |
| 21 | 31 | 18 | 26 | 7 |
| 22 | 52 | 23 | 18 | 3 |
| 23 | 51 | 22 | 15 | 4 |
| 25 | 65 | 18 | 17 | 7 |
| 27 | 46 | 20 | 15 | 4 |
| 29 | 61 | 23 | 8 | 1 |
| 30 | 47 | 26 | 18 | 5 |
| 34 | 41 | 22 | 24 | 6 |
| 36 | 41 | 18 | 21 | 6 |
| 39 | 72 | 25 | 9 | 4 |
| 40 | 54 | 22 | 10 | 3 |
| 41 | 54 | 26 | 14 | 2 |
| 42 | 49 | 23 | 8 | 1 |
| 44 | 40 | 20 | 16 | 2 |
| 45 | 46 | 26 | 14 | 2 |
| 46 | 35 | 25 | 10 | 6 |
| 47 | 44 | 16 | 17 | 6 |
| 48 | 41 | 30 | 7 | 1 |
| 49 | 30 | 20 | 28 | 7 |
| 50 | 31 | 25 | 19 | 4 |
| 53 | 45 | 19 | 13 | 3 |
| 54 | 55 | 24 | 11 | 7 |
| 56 | 58 | 26 | 14 | 1 |
| 57 | 36 | 23 | 9 | 4 |
| 60 | 32 | 30 | 11 | 7 |
| 61 | 51 | 21 | 8 | 2 |
| 62 | 32 | 16 | 16 | 7 |
| 63 | 54 | 23 | 12 | 4 |
| 65 | 41 | 17 | 24 | 4 |
| 66 | 52 | 27 | 7 | 2 |
| 67 | 61 | 27 | 13 | 7 |
| 68 | 38 | 17 | 16 | 3 |
| 69 | 38 | 18 | 25 | 4 |
| 71 | 58 | 19 | 7 | 1 |
| 73 | 46 | 16 | 12 | 5 |
| 74 | 72 | 24 | 24 | 5 |
| 76 | 49 | 24 | 16 | 2 |
| 78 | 38 | 26 | 8 | 4 |
| 79 | 40 | 18 | 27 | 6 |
| 80 | 40 | 20 | 11 | 4 |
| 84 | 47 | 22 | 8 | 1 |
| 85 | 49 | 22 | 28 | 6 |
| 86 | 62 | 24 | 27 | 6 |
| 87 | 50 | 18 | 15 | 7 |
| 89 | 26 | 18 | 24 | 7 |
| 90 | 46 | 18 | 25 | 4 |
| 91 | 45 | 23 | 22 | 6 |
| 92 | 70 | 28 | 9 | 6 |
| 93 | 26 | 22 | 11 | 5 |
| 94 | 26 | 21 | 17 | 4 |
| 95 | 53 | 16 | 19 | 6 |
| 96 | 43 | 27 | 15 | 4 |
| 97 | 22 | 22 | 27 | 4 |
| 98 | 35 | 19 | 14 | 3 |
| 99 | 41 | 17 | 17 | 4 |
| 100 | 48 | 16 | 26 | 7 |
| 101 | 62 | 25 | 14 | 2 |
| 102 | 53 | 22 | 13 | 4 |
| 105 | 28 | 28 | 8 | 5 |
| 107 | 45 | 29 | 15 | 4 |
| 109 | 48 | 25 | 13 | 5 |
| 111 | 36 | 27 | 13 | 5 |
| 113 | 65 | 24 | 15 | 5 |
| 114 | 29 | 21 | 8 | 3 |
| 116 | 42 | 21 | 20 | 7 |
| 117 | 39 | 17 | 14 | 4 |
| 118 | 53 | 22 | 13 | 4 |
| 119 | 43 | 23 | 13 | 5 |
| 120 | 43 | 23 | 8 | 3 |
| 121 | 36 | 20 | 20 | 6 |
| 122 | 40 | 19 | 20 | 4 |
| 123 | 67 | 29 | 20 | 6 |
| 124 | 45 | 29 | 15 | 5 |
| 125 | 28 | 19 | 13 | 5 |
| 127 | 33 | 22 | 16 | 3 |
| 128 | 28 | 25 | 26 | 5 |
| 129 | 62 | 22 | 8 | 4 |
| 130 | 30 | 23 | 9 | 3 |
| 131 | 37 | 21 | 7 | 1 |
| 132 | 41 | 22 | 7 | 2 |
| 133 | 47 | 20 | 9 | 1 |
| 134 | 56 | 23 | 14 | 4 |
| 135 | 50 | 16 | 27 | 7 |
| 136 | 57 | 20 | 16 | 3 |
| 137 | 51 | 29 | 8 | 1 |
| 138 | 28 | 20 | 27 | 6 |
| 139 | 45 | 17 | 8 | 3 |
| 140 | 34 | 22 | 15 | 5 |
| 141 | 44 | 29 | 8 | 1 |
| 142 | 37 | 19 | 15 | 3 |
| 144 | 38 | 21 | 14 | 4 |
| 145 | 56 | 23 | 10 | 1 |
| 148 | 67 | 28 | 15 | 6 |
| 149 | 46 | 30 | 8 | 5 |
| 150 | 48 | 17 | 27 | 5 |
| 152 | 43 | 25 | 7 | 1 |
| 153 | 41 | 21 | 22 | 4 |
| 154 | 41 | 21 | 8 | 2 |
| 155 | 51 | 29 | 7 | 2 |
| 156 | 49 | 16 | 17 | 5 |
| 157 | 26 | 16 | 12 | 4 |
| 158 | 38 | 24 | 9 | 4 |
| 161 | 64 | 25 | 8 | 2 |
| 163 | 46 | 24 | 12 | 4 |
| 164 | 44 | 17 | 16 | 5 |
| 166 | 59 | 16 | 12 | 3 |
| 167 | 60 | 20 | 21 | 6 |
| 170 | 55 | 25 | 9 | 1 |
| 171 | 49 | 30 | 27 | 2 |
| 172 | 53 | 20 | 13 | 2 |
| 173 | 37 | 30 | 8 | 1 |
| 174 | 51 | 20 | 19 | 4 |
| 176 | 63 | 21 | 9 | 5 |
| 177 | 48 | 30 | 7 | 4 |
| 178 | 58 | 28 | 9 | 1 |
| 179 | 57 | 17 | 13 | 6 |
| 180 | 49 | 25 | 12 | 3 |
| 182 | 51 | 17 | 14 | 4 |
| 184 | 56 | 22 | 10 | 6 |
| 185 | 46 | 18 | 12 | 3 |
| 186 | 40 | 20 | 22 | 4 |
| 187 | 55 | 26 | 10 | 2 |
| 188 | 30 | 16 | 21 | 3 |
| 189 | 54 | 24 | 8 | 3 |
| 190 | 55 | 27 | 8 | 1 |
| 191 | 42 | 29 | 10 | 3 |
| 193 | 42 | 22 | 19 | 7 |
| 196 | 34 | 19 | 24 | 3 |
| 198 | 58 | 26 | 10 | 4 |
| 199 | 53 | 30 | 7 | 1 |
| 204 | 40 | 18 | 7 | 1 |
| 205 | 42 | 18 | 22 | 5 |
| 206 | 36 | 21 | 10 | 2 |
| 207 | 58 | 19 | 8 | 1 |
| 208 | 40 | 21 | 12 | 4 |
| 209 | 68 | 25 | 14 | 5 |
| 213 | 41 | 27 | 20 | 4 |
| 214 | 32 | 27 | 12 | 3 |
| 215 | 50 | 16 | 19 | 5 |
| 216 | 31 | 17 | 18 | 5 |
| 220 | 33 | 22 | 8 | 3 |
| 223 | 30 | 16 | 7 | 3 |
| 224 | 41 | 22 | 13 | 3 |
| 226 | 42 | 22 | 26 | 4 |
| 228 | 51 | 20 | 15 | 4 |
| 229 | 47 | 20 | 8 | 5 |
| 231 | 30 | 21 | 28 | 3 |
| 233 | 49 | 30 | 15 | 1 |
| 234 | 58 | 25 | 7 | 3 |
| 237 | 54 | 22 | 19 | 6 |
| 238 | 58 | 17 | 9 | 1 |
| 239 | 49 | 27 | 14 | 1 |
| 240 | 57 | 21 | 13 | 5 |
| 241 | 46 | 27 | 7 | 5 |
| 242 | 40 | 25 | 9 | 3 |
| 243 | 29 | 28 | 7 | 3 |
| 244 | 53 | 23 | 12 | 4 |
| 245 | 41 | 16 | 13 | 5 |
| 246 | 31 | 20 | 14 | 3 |
| 247 | 48 | 21 | 11 | 4 |
| 248 | 43 | 21 | 10 | 1 |
| 249 | 66 | 17 | 21 | 2 |
| 250 | 40 | 20 | 9 | 4 |
| 252 | 41 | 27 | 24 | 4 |
| 253 | 63 | 19 | 13 | 4 |
| 254 | 42 | 27 | 8 | 4 |
| 255 | 58 | 20 | 21 | 7 |
| 256 | 52 | 28 | 20 | 6 |
| 257 | 51 | 27 | 9 | 6 |
| 258 | 58 | 28 | 9 | 1 |
| 259 | 69 | 28 | 15 | 4 |
| 260 | 41 | 20 | 20 | 4 |
| 261 | 37 | 25 | 11 | 6 |
| 265 | 45 | 21 | 7 | 3 |
| 266 | 47 | 18 | 8 | 3 |
| 267 | 57 | 20 | 14 | 3 |
| 268 | 60 | 21 | 10 | 4 |
| 269 | 50 | 20 | 18 | 6 |
| 270 | 36 | 25 | 10 | 4 |
| 272 | 74 | 28 | 7 | 1 |
| 273 | 50 | 22 | 10 | 1 |
| 274 | 61 | 29 | 8 | 2 |
| 275 | 53 | 24 | 13 | 4 |
Listwise deletion: pros and cons
Pros:
Produces the correct parameter estimates if missingness is MCAR
- If not, biased
Cons:
- Can result in a lot of data loss
Casewise (pairwise) deletion
- In each comparison, delete only observations if the missing data is relevant to this comparison
| id | age | control | depress | stress |
|---|---|---|---|---|
| 1 | 68 | 13 | NA | 5 |
| 2 | 38 | 19 | 28 | 7 |
| 3 | 31 | 20 | 8 | 4 |
| 4 | 31 | 17 | 28 | 7 |
| 5 | 58 | 22 | 12 | 3 |
| 6 | 63 | 26 | 13 | 5 |
| 7 | 38 | 16 | 23 | 5 |
| 8 | 54 | 30 | 12 | 1 |
| 9 | 66 | 20 | 9 | 3 |
| 10 | 31 | 27 | NA | 2 |
| 11 | 37 | 25 | 21 | 7 |
| 12 | 48 | 14 | NA | 4 |
| 13 | 33 | 17 | 20 | 4 |
| 14 | 47 | 13 | NA | 5 |
| 15 | 30 | 15 | NA | 1 |
| 16 | 48 | 29 | 8 | 3 |
| 17 | 58 | 27 | 13 | 1 |
| 18 | 51 | 26 | 9 | 4 |
| 19 | 47 | 21 | 15 | 2 |
| 20 | 41 | 17 | 18 | 5 |
| 21 | 31 | 18 | 26 | 7 |
| 22 | 52 | 23 | 18 | 3 |
| 23 | 51 | 22 | 15 | 4 |
| 24 | 53 | 14 | NA | 2 |
| 25 | 65 | 18 | 17 | 7 |
| 26 | 47 | 18 | NA | 4 |
| 27 | 46 | 20 | 15 | 4 |
| 28 | 34 | 6 | NA | 4 |
| 29 | 61 | 23 | 8 | 1 |
| 30 | 47 | 26 | 18 | 5 |
| 31 | 65 | 19 | NA | 4 |
| 32 | 37 | 14 | NA | 5 |
| 33 | 48 | 14 | NA | 6 |
| 34 | 41 | 22 | 24 | 6 |
| 35 | 41 | 14 | NA | 3 |
| 36 | 41 | 18 | 21 | 6 |
| 37 | 42 | 9 | NA | 1 |
| 38 | 33 | 24 | NA | 4 |
| 39 | 72 | 25 | 9 | 4 |
| 40 | 54 | 22 | 10 | 3 |
| 41 | 54 | 26 | 14 | 2 |
| 42 | 49 | 23 | 8 | 1 |
| 43 | 43 | 20 | NA | 1 |
| 44 | 40 | 20 | 16 | 2 |
| 45 | 46 | 26 | 14 | 2 |
| 46 | 35 | 25 | 10 | 6 |
| 47 | 44 | 16 | 17 | 6 |
| 48 | 41 | 30 | 7 | 1 |
| 49 | 30 | 20 | 28 | 7 |
| 50 | 31 | 25 | 19 | 4 |
| 51 | 43 | 13 | NA | 6 |
| 52 | 31 | 15 | NA | 1 |
| 53 | 45 | 19 | 13 | 3 |
| 54 | 55 | 24 | 11 | 7 |
| 55 | 50 | 13 | NA | 7 |
| 56 | 58 | 26 | 14 | 1 |
| 57 | 36 | 23 | 9 | 4 |
| 58 | 45 | 28 | NA | 4 |
| 59 | 50 | 24 | NA | 1 |
| 60 | 32 | 30 | 11 | 7 |
| 61 | 51 | 21 | 8 | 2 |
| 62 | 32 | 16 | 16 | 7 |
| 63 | 54 | 23 | 12 | 4 |
| 64 | 36 | 13 | NA | 1 |
| 65 | 41 | 17 | 24 | 4 |
| 66 | 52 | 27 | 7 | 2 |
| 67 | 61 | 27 | 13 | 7 |
| 68 | 38 | 17 | 16 | 3 |
| 69 | 38 | 18 | 25 | 4 |
| 70 | 46 | 29 | NA | 2 |
| 71 | 58 | 19 | 7 | 1 |
| 72 | 37 | 22 | NA | 4 |
| 73 | 46 | 16 | 12 | 5 |
| 74 | 72 | 24 | 24 | 5 |
| 75 | 32 | 15 | NA | 6 |
| 76 | 49 | 24 | 16 | 2 |
| 77 | 46 | 8 | NA | 6 |
| 78 | 38 | 26 | 8 | 4 |
| 79 | 40 | 18 | 27 | 6 |
| 80 | 40 | 20 | 11 | 4 |
| 81 | 53 | 27 | NA | 3 |
| 82 | 55 | 12 | NA | 4 |
| 83 | 23 | 15 | NA | 3 |
| 84 | 47 | 22 | 8 | 1 |
| 85 | 49 | 22 | 28 | 6 |
| 86 | 62 | 24 | 27 | 6 |
| 87 | 50 | 18 | 15 | 7 |
| 88 | 52 | 21 | NA | 4 |
| 89 | 26 | 18 | 24 | 7 |
| 90 | 46 | 18 | 25 | 4 |
| 91 | 45 | 23 | 22 | 6 |
| 92 | 70 | 28 | 9 | 6 |
| 93 | 26 | 22 | 11 | 5 |
| 94 | 26 | 21 | 17 | 4 |
| 95 | 53 | 16 | 19 | 6 |
| 96 | 43 | 27 | 15 | 4 |
| 97 | 22 | 22 | 27 | 4 |
| 98 | 35 | 19 | 14 | 3 |
| 99 | 41 | 17 | 17 | 4 |
| 100 | 48 | 16 | 26 | 7 |
| 101 | 62 | 25 | 14 | 2 |
| 102 | 53 | 22 | 13 | 4 |
| 103 | 46 | 13 | NA | 4 |
| 104 | 59 | 13 | NA | 1 |
| 105 | 28 | 28 | 8 | 5 |
| 106 | 31 | 14 | NA | 4 |
| 107 | 45 | 29 | 15 | 4 |
| 108 | 38 | 21 | NA | 7 |
| 109 | 48 | 25 | 13 | 5 |
| 110 | 32 | 9 | NA | 5 |
| 111 | 36 | 27 | 13 | 5 |
| 112 | 46 | 14 | NA | 5 |
| 113 | 65 | 24 | 15 | 5 |
| 114 | 29 | 21 | 8 | 3 |
| 115 | 34 | 17 | NA | 7 |
| 116 | 42 | 21 | 20 | 7 |
| 117 | 39 | 17 | 14 | 4 |
| 118 | 53 | 22 | 13 | 4 |
| 119 | 43 | 23 | 13 | 5 |
| 120 | 43 | 23 | 8 | 3 |
| 121 | 36 | 20 | 20 | 6 |
| 122 | 40 | 19 | 20 | 4 |
| 123 | 67 | 29 | 20 | 6 |
| 124 | 45 | 29 | 15 | 5 |
| 125 | 28 | 19 | 13 | 5 |
| 126 | 59 | 13 | NA | 6 |
| 127 | 33 | 22 | 16 | 3 |
| 128 | 28 | 25 | 26 | 5 |
| 129 | 62 | 22 | 8 | 4 |
| 130 | 30 | 23 | 9 | 3 |
| 131 | 37 | 21 | 7 | 1 |
| 132 | 41 | 22 | 7 | 2 |
| 133 | 47 | 20 | 9 | 1 |
| 134 | 56 | 23 | 14 | 4 |
| 135 | 50 | 16 | 27 | 7 |
| 136 | 57 | 20 | 16 | 3 |
| 137 | 51 | 29 | 8 | 1 |
| 138 | 28 | 20 | 27 | 6 |
| 139 | 45 | 17 | 8 | 3 |
| 140 | 34 | 22 | 15 | 5 |
| 141 | 44 | 29 | 8 | 1 |
| 142 | 37 | 19 | 15 | 3 |
| 143 | 43 | 17 | NA | 7 |
| 144 | 38 | 21 | 14 | 4 |
| 145 | 56 | 23 | 10 | 1 |
| 146 | 34 | 11 | NA | 4 |
| 147 | 67 | 20 | NA | 1 |
| 148 | 67 | 28 | 15 | 6 |
| 149 | 46 | 30 | 8 | 5 |
| 150 | 48 | 17 | 27 | 5 |
| 151 | 46 | 12 | NA | 7 |
| 152 | 43 | 25 | 7 | 1 |
| 153 | 41 | 21 | 22 | 4 |
| 154 | 41 | 21 | 8 | 2 |
| 155 | 51 | 29 | 7 | 2 |
| 156 | 49 | 16 | 17 | 5 |
| 157 | 26 | 16 | 12 | 4 |
| 158 | 38 | 24 | 9 | 4 |
| 159 | 48 | 11 | NA | 5 |
| 160 | 19 | 12 | NA | 6 |
| 161 | 64 | 25 | 8 | 2 |
| 162 | 65 | 12 | NA | 3 |
| 163 | 46 | 24 | 12 | 4 |
| 164 | 44 | 17 | 16 | 5 |
| 165 | 53 | 9 | NA | 7 |
| 166 | 59 | 16 | 12 | 3 |
| 167 | 60 | 20 | 21 | 6 |
| 168 | 28 | 13 | NA | 4 |
| 169 | 45 | 23 | NA | 2 |
| 170 | 55 | 25 | 9 | 1 |
| 171 | 49 | 30 | 27 | 2 |
| 172 | 53 | 20 | 13 | 2 |
| 173 | 37 | 30 | 8 | 1 |
| 174 | 51 | 20 | 19 | 4 |
| 175 | 55 | 27 | NA | 1 |
| 176 | 63 | 21 | 9 | 5 |
| 177 | 48 | 30 | 7 | 4 |
| 178 | 58 | 28 | 9 | 1 |
| 179 | 57 | 17 | 13 | 6 |
| 180 | 49 | 25 | 12 | 3 |
| 181 | 32 | 15 | NA | 6 |
| 182 | 51 | 17 | 14 | 4 |
| 183 | 78 | 28 | NA | 4 |
| 184 | 56 | 22 | 10 | 6 |
| 185 | 46 | 18 | 12 | 3 |
| 186 | 40 | 20 | 22 | 4 |
| 187 | 55 | 26 | 10 | 2 |
| 188 | 30 | 16 | 21 | 3 |
| 189 | 54 | 24 | 8 | 3 |
| 190 | 55 | 27 | 8 | 1 |
| 191 | 42 | 29 | 10 | 3 |
| 192 | 57 | 14 | NA | 5 |
| 193 | 42 | 22 | 19 | 7 |
| 194 | 37 | 14 | NA | 4 |
| 195 | 44 | 9 | NA | 1 |
| 196 | 34 | 19 | 24 | 3 |
| 197 | 31 | 20 | NA | 6 |
| 198 | 58 | 26 | 10 | 4 |
| 199 | 53 | 30 | 7 | 1 |
| 200 | 33 | 22 | NA | 5 |
| 201 | 19 | 7 | NA | 3 |
| 202 | 61 | 13 | NA | 4 |
| 203 | 42 | 17 | NA | 3 |
| 204 | 40 | 18 | 7 | 1 |
| 205 | 42 | 18 | 22 | 5 |
| 206 | 36 | 21 | 10 | 2 |
| 207 | 58 | 19 | 8 | 1 |
| 208 | 40 | 21 | 12 | 4 |
| 209 | 68 | 25 | 14 | 5 |
| 210 | 34 | 23 | NA | 4 |
| 211 | 49 | 19 | NA | 3 |
| 212 | 42 | 21 | NA | 6 |
| 213 | 41 | 27 | 20 | 4 |
| 214 | 32 | 27 | 12 | 3 |
| 215 | 50 | 16 | 19 | 5 |
| 216 | 31 | 17 | 18 | 5 |
| 217 | 34 | 14 | NA | 6 |
| 218 | 47 | 14 | NA | 5 |
| 219 | 41 | 19 | NA | 2 |
| 220 | 33 | 22 | 8 | 3 |
| 221 | 46 | 13 | NA | 7 |
| 222 | 25 | 14 | NA | 5 |
| 223 | 30 | 16 | 7 | 3 |
| 224 | 41 | 22 | 13 | 3 |
| 225 | 48 | 8 | NA | 7 |
| 226 | 42 | 22 | 26 | 4 |
| 227 | 46 | 20 | NA | 6 |
| 228 | 51 | 20 | 15 | 4 |
| 229 | 47 | 20 | 8 | 5 |
| 230 | 37 | 22 | NA | 1 |
| 231 | 30 | 21 | 28 | 3 |
| 232 | 38 | 29 | NA | 4 |
| 233 | 49 | 30 | 15 | 1 |
| 234 | 58 | 25 | 7 | 3 |
| 235 | 47 | 15 | NA | 5 |
| 236 | 55 | 26 | NA | 4 |
| 237 | 54 | 22 | 19 | 6 |
| 238 | 58 | 17 | 9 | 1 |
| 239 | 49 | 27 | 14 | 1 |
| 240 | 57 | 21 | 13 | 5 |
| 241 | 46 | 27 | 7 | 5 |
| 242 | 40 | 25 | 9 | 3 |
| 243 | 29 | 28 | 7 | 3 |
| 244 | 53 | 23 | 12 | 4 |
| 245 | 41 | 16 | 13 | 5 |
| 246 | 31 | 20 | 14 | 3 |
| 247 | 48 | 21 | 11 | 4 |
| 248 | 43 | 21 | 10 | 1 |
| 249 | 66 | 17 | 21 | 2 |
| 250 | 40 | 20 | 9 | 4 |
| 251 | 38 | 28 | NA | 1 |
| 252 | 41 | 27 | 24 | 4 |
| 253 | 63 | 19 | 13 | 4 |
| 254 | 42 | 27 | 8 | 4 |
| 255 | 58 | 20 | 21 | 7 |
| 256 | 52 | 28 | 20 | 6 |
| 257 | 51 | 27 | 9 | 6 |
| 258 | 58 | 28 | 9 | 1 |
| 259 | 69 | 28 | 15 | 4 |
| 260 | 41 | 20 | 20 | 4 |
| 261 | 37 | 25 | 11 | 6 |
| 262 | 61 | 19 | NA | 5 |
| 263 | 47 | 15 | NA | 3 |
| 264 | 45 | 23 | NA | 3 |
| 265 | 45 | 21 | 7 | 3 |
| 266 | 47 | 18 | 8 | 3 |
| 267 | 57 | 20 | 14 | 3 |
| 268 | 60 | 21 | 10 | 4 |
| 269 | 50 | 20 | 18 | 6 |
| 270 | 36 | 25 | 10 | 4 |
| 271 | 20 | 14 | NA | 4 |
| 272 | 74 | 28 | 7 | 1 |
| 273 | 50 | 22 | 10 | 1 |
| 274 | 61 | 29 | 8 | 2 |
| 275 | 53 | 24 | 13 | 4 |
Casewise deletion: pros and cons
Pros:
Avoids data loss
Non-biased
- Only for MCAR
Cons:
- But, results not completely consistent or comparable–based on different observations
Methods for MAR
Unconditional (mean) imputation - Bad
Replace missing values with the mean of the observed values
Reduces variance
- Increases Type 1 error rate
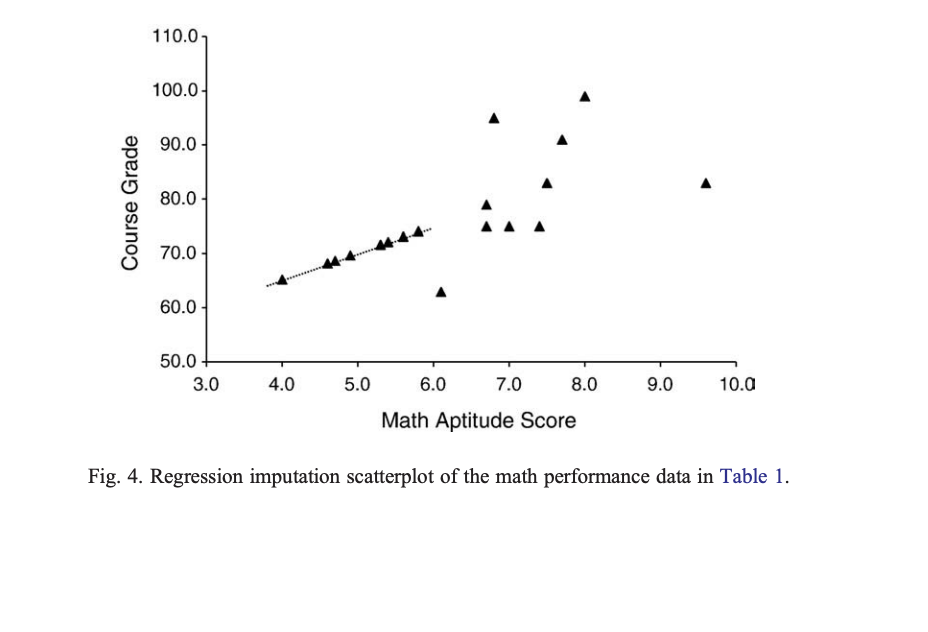
Conditional imputation (regression)
- Run a regression using the complete data to replace the missing value
All the other related variables in the data set are used to predict the values of the variable with missing data
Missing scores have the predicted values provided to replace them
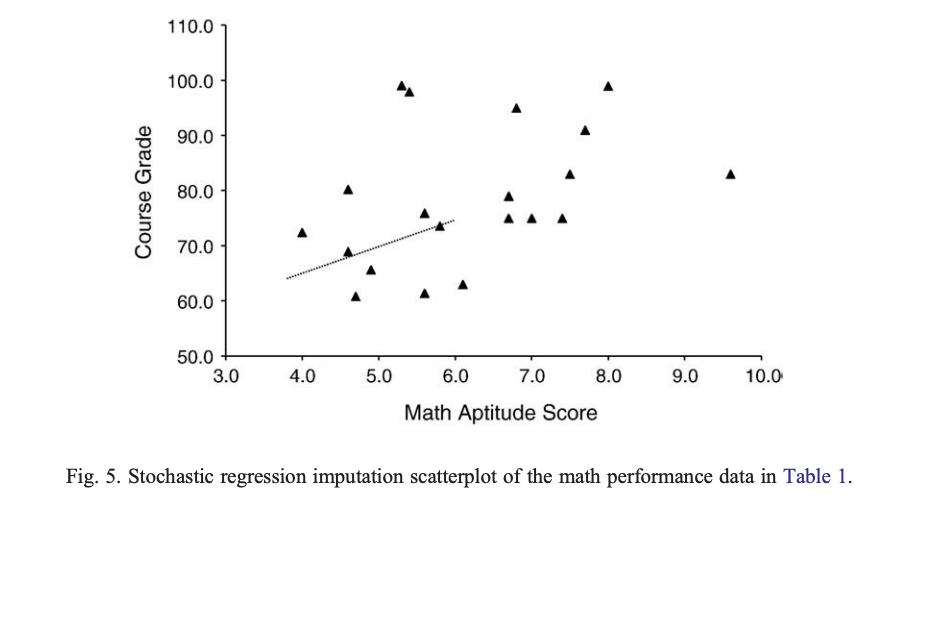
Stochastic Regression
- Regression imputation with added error variance to predicted values
MI
Multiple Imputation
Instead of using one value as a true value (which ignores uncertainty and variance), we use multiple values
Basically doing conditional imputation several times
- Several steps
- We make several multiply imputed data sets with the
mice()function
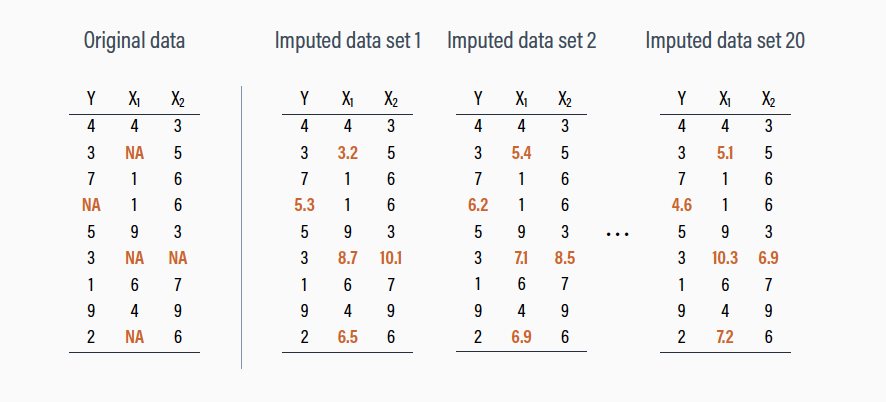
Multiple Imputation
- We fit our model of choice to each version of the data with the
with()function
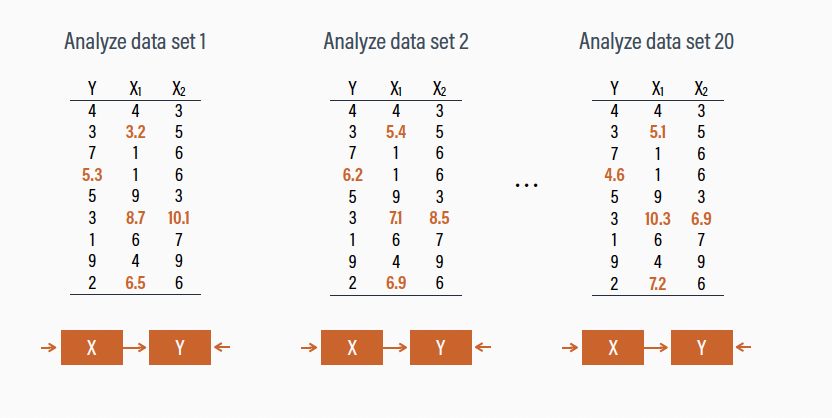
Multiple Imputation
- We then pool (i.e., combine) the results with the
pool()function
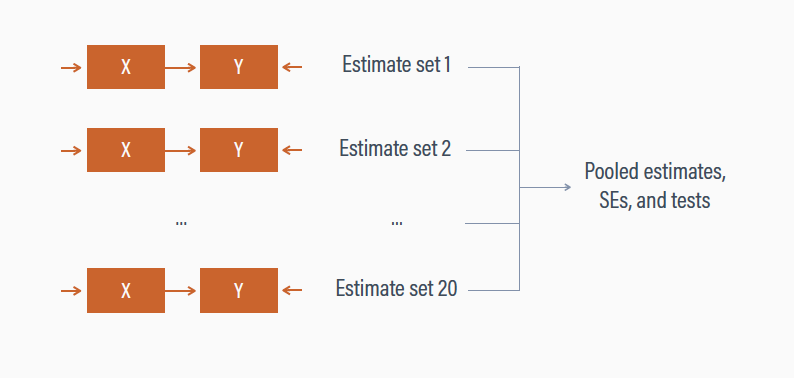
Multiple Imputation
1. Impute with Mice
- What is
imp?
List of 22
 $ data           :'data.frame':    275 obs. of  5 variables:
 $ imp            :List of 5
 $ m              : num 5
 $ where          : logi [1:275, 1:5] FALSE FALSE FALSE FALSE FALSE FALSE ...
  ..- attr(*, "dimnames")=List of 2
 $ blocks         :List of 5
  ..- attr(*, "calltype")= Named chr [1:5] "type" "type" "type" "type" ...
  .. ..- attr(*, "names")= chr [1:5] "id" "age" "control" "depress" ...
 $ call           : language mice(data = dat, m = m, method = "pmm", printFlag = FALSE, seed = 24415)
 $ nmis           : Named int [1:5] 0 0 0 77 0
  ..- attr(*, "names")= chr [1:5] "id" "age" "control" "depress" ...
 $ method         : Named chr [1:5] "" "" "" "pmm" ...
  ..- attr(*, "names")= chr [1:5] "id" "age" "control" "depress" ...
 $ predictorMatrix: num [1:5, 1:5] 0 1 1 1 1 1 0 1 1 1 ...
  ..- attr(*, "dimnames")=List of 2
 $ visitSequence  : chr [1:5] "id" "age" "control" "depress" ...
 $ formulas       :List of 5
 $ post           : Named chr [1:5] "" "" "" "" ...
  ..- attr(*, "names")= chr [1:5] "id" "age" "control" "depress" ...
 $ blots          :List of 5
 $ ignore         : logi [1:275] FALSE FALSE FALSE FALSE FALSE FALSE ...
 $ seed           : num 24415
 $ iteration      : num 5
 $ lastSeedValue  : int [1:626] 10403 359 1009391010 -1973990381 908174720 -738124646 251387381 -1899514340 395796544 1088258267 ...
 $ chainMean      : num [1:5, 1:5, 1:5] NaN NaN NaN 16.8 NaN ...
  ..- attr(*, "dimnames")=List of 3
 $ chainVar       : num [1:5, 1:5, 1:5] NA NA NA 47.1 NA ...
  ..- attr(*, "dimnames")=List of 3
 $ loggedEvents   : NULL
 $ version        :Classes 'package_version', 'numeric_version'  hidden list of 1
 $ date           : Date[1:1], format: "2024-02-11"
 - attr(*, "class")= chr "mids"
1. Impute with Mice
- What is
impwithinimp?
List of 5
 $ id     :'data.frame':    0 obs. of  5 variables:
 $ age    :'data.frame':    0 obs. of  5 variables:
 $ control:'data.frame':    0 obs. of  5 variables:
 $ depress:'data.frame':    77 obs. of  5 variables:
$ stress :'data.frame': 0 obs. of 5 variables: 1 2 3 4 5
1 28 26 18 21 13
10 12 7 8 14 8
12 19 23 10 11 27
14 24 27 20 21 27
15 19 14 15 14 12
24 26 13 8 13 12PMM
Predictive mean matching
- For each missing value, a regression model is fitted using the observed (complete) data, where the variable with missing data is the outcome and other variables are predictors
- For a record with a missing value, the fitted model predicts a mean based on the available data
- PMM identifies a set of “donors” from the observed data. These donors are the cases whose predicted means are closest to the predicted mean of the case with the missing value
2. Model with Mice
- We’ll fit a simple statistical model
#fit the model to each set of imputaed data

fit <- with(data = imp, expr = lm(depress ~ control))

summary(fit) %>%
kable()| term | estimate | std.error | statistic | p.value | nobs |
|---|---|---|---|---|---|
| (Intercept) | 26.5853480 | 1.3951117 | 19.056071 | 0 | 275 |
| control | -0.5579633 | 0.0651453 | -8.564900 | 0 | 275 |
| (Intercept) | 26.3445428 | 1.4404262 | 18.289409 | 0 | 275 |
| control | -0.5397109 | 0.0672613 | -8.024091 | 0 | 275 |
| (Intercept) | 24.9087161 | 1.4261998 | 17.465096 | 0 | 275 |
| control | -0.4880730 | 0.0665970 | -7.328753 | 0 | 275 |
| (Intercept) | 24.3346289 | 1.3947519 | 17.447282 | 0 | 275 |
| control | -0.4644524 | 0.0651285 | -7.131319 | 0 | 275 |
| (Intercept) | 24.9290442 | 1.3967357 | 17.848076 | 0 | 275 |
| control | -0.4862499 | 0.0652212 | -7.455400 | 0 | 275 |
3. Mice Pool Results
3. Mice Pool Results
emmeansdoes not play nicely withmiceobjectsmarginaleffects- Can be used to perform hypothesis tests on coefficients
Plot Imputations
- Make sure they look similar to real data

Maximum likelihood (ML)
ML
Determines the most probable settings (parameter estimates) for a statistical model by making the model’s predicted outcomes as close as possible to the observed data
Each observation’s contribution to estimation is restricted to the subset of parameters for which there is data
Estimation uses incomplete data, no imputation performed
ML
Implicit imputation
Each participant contributes their observed data
Data are not filled in, but the multivariate normal distribution acts like an imputation machine
The location of the observed data implies the probable position of the unseen data, and estimates are adjusted accordingly
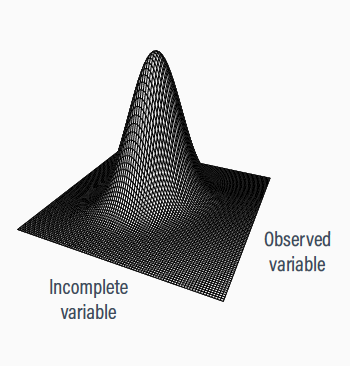
Chronic pain illustration
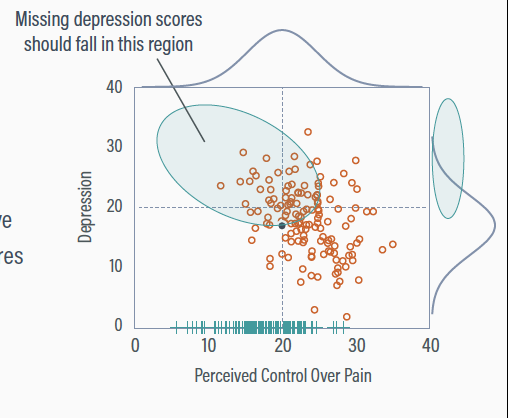
Participants with low perceived control are more likely to have missing depression scores (conditionally MAR)
The true means are both 20
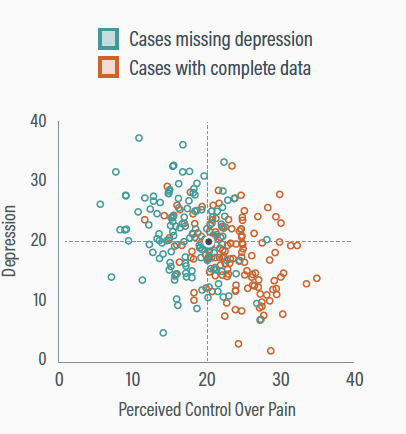
Deleting incomplete information
Deleting cases with missing depression scores gives a non-representative sample
The perceived control mean is too high (Mpc = 23.1), and the depression mean is too low (Mdep = 17.2)
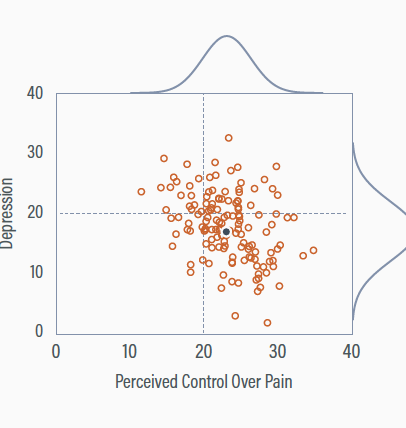
Partial data
Incorporating the partial data gives a complete set of perceived control scores
The partial data records primarily have low perceived control scores
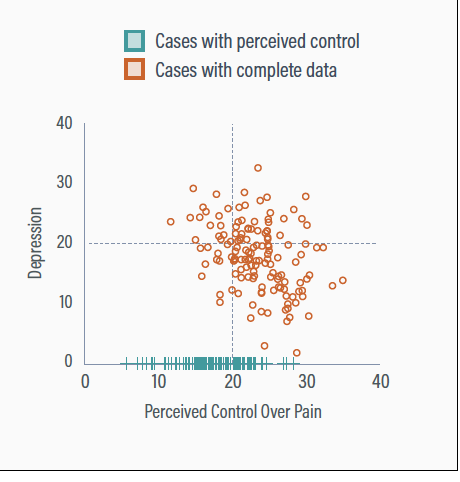
Adjusting perceived control
Adding low perceived control scores increases the variable’s variability
The perceived control mean receives a downward adjustment to accommodate the influx of low scores
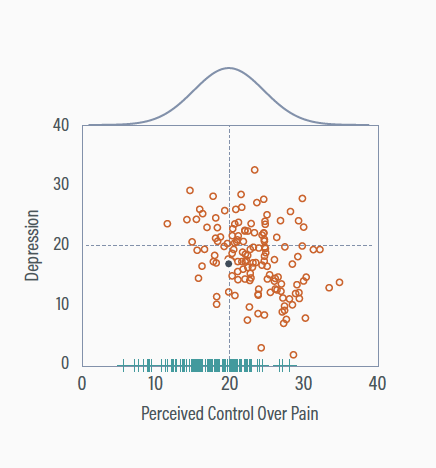
Implicit Imputation
Maximum likelihood assumes multivariate normality
In a normal distribution with a negative correlation, low perceived control scores should pair with high depression
Adjusting Depression Distribution
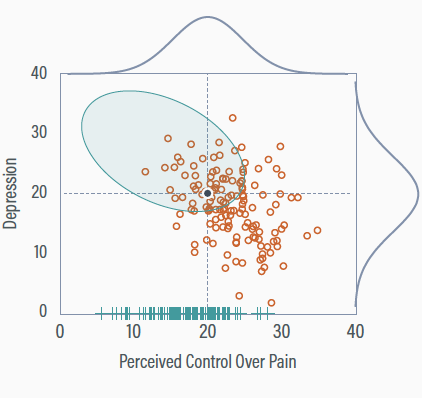
Maximum likelihood intuits the presence of the elevated but unseen depression scores
The mean and variance of depression increase to accommodate observed perceived control scores at the low end
ML: Cons
Generally limited to normal data, options for mixed metrics are less common
Normal-theory methods are biased with interactions and non-linear terms
MLM software usually discards observations with missing predictors
Distinguish between NMAR and MAR
Pray you don’t have to 😂
It’s complicated
- Not many good techniques
NMAR into MAR
Try and track down the missing data
Auxiliary variables
Collect more data for explaining missingness
Distinguish between NMAR and MAR

Reporting Missing Data
- Template from Stepf van Buuren
Tip
The percentage of missing values across the nine variables varied between 0 and 34%. In total 1601 out of 3801 records (42%) were incomplete. Many girls had no score because the nurse felt that the measurement was “unnecessary,” or because the girl did not give permission. Older girls had many more missing data. We used multiple imputation to create and analyze 40 multiply imputed datasets. Methodologists currently regard multiple imputation as a state-of-the-art technique because it improves accuracy and statistical power relative to other missing data techniques. Incomplete variables were imputed under fully conditional specification, using the default settings of the mice 3.0 package (Van Buuren and Groothuis-Oudshoorn 2011). The parameters of substantive interest were estimated in each imputed dataset separately, and combined using Rubin’s rules. For comparison, we also performed the analysis on the subset of complete cases.
Report
- Amount of missing data
- Reasons for missingness
- Consequences
- Method
- Imputation model
- Pooling
- Software
- Complete-case analysis
Is it MCAR, MAR, NMAR?
The post-experiment manipulation-check questionnaires for five participants were accidentally thrown away.
- MCAR
Is it MCAR, MAR, NMAR?
In a 2-day memory experiment, people who know they would do poorly on the memory test are discouraged and don’t want to return for the second session
- NMAR
Is it MCAR, MAR, NMAR?
A health psychologist is surveying high school students on marijuana use. Students who scored highly on anxiety left these questions blank.
- MAR
Wrap up
When you have missing data, think about WHY they are missing
Missing data handled improperly can bias your expectations
MI and ML are good ways to handle missing data!
Bayesian methods are good too :)
Inverse probability weighting seem to work well (Gomila and Clark 2022)
PSY 504: Advaced Statistics

